TuhinNova

Categories
  • Physics
  • Astronomy & Space
  • Biology
  • Health & Medicine
  • Earth Science
  • Archaeology
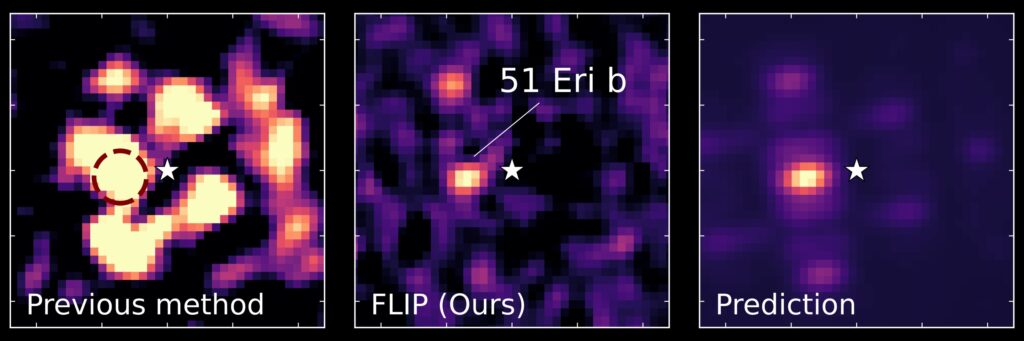
Left: JWST/NIRCam observation of star 51 Eridani A (51 Eri) in the F430M filter, using the standard method KLIP (Soummer et al. 2012) to subtract the glare of the star. This method was not able to detect the planet 51 Eri b in the original analysis (Balmer et al. 2025), whose expected location is marked with a dashed circle. Middle: The same observation, but using the new method FLIP (Ferrer-Chavez et al. 2026) to subtract the glare of the star. Astrophysicists obtained a significant detection (>5 sigma) of 51 Eri b. Right: Simulated image of 51 Eri b, highlighting that the planet is detected at its expected location and that the planet signal has the expected morphology. The location of the star 51 Eri is marked with a star symbol. Credit: Rodrigo Ferrer-Chavez

James Webb’s new way of separating starlight from planetary light brings 51 Eridani b into view at 4.3 micrometers, where conventional image processing had failed to detect it

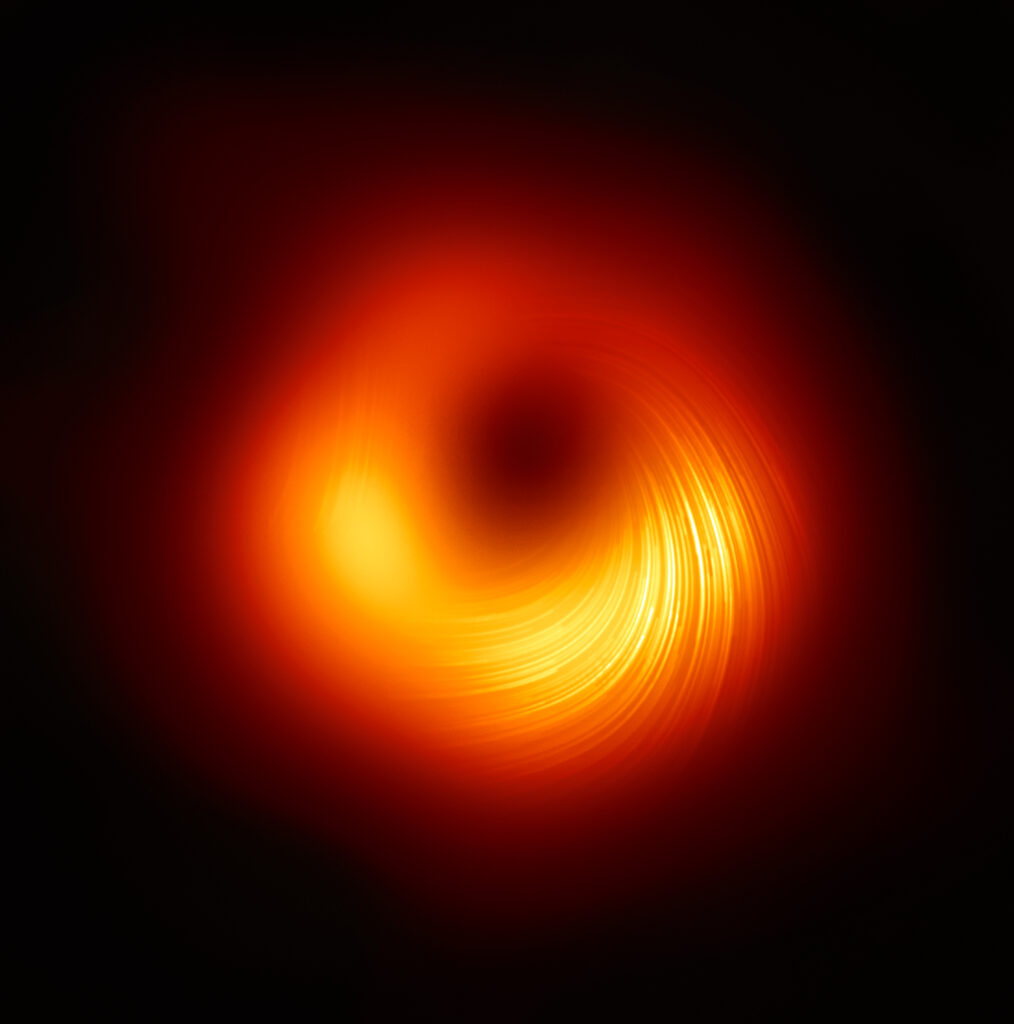
This Event Horizon Telescope image reveals the black hole at the center of Messier 87, a massive galaxy in the nearby Virgo galaxy cluster. The first direct visual evidence of a supermassive black hole and its shadow. Credit: Event Horizon Telescope Collaboration et al. 2019.

The black hole at the center of M87 has a 42.2-microarcsecond shadow and a mass 6.5 billion times that of the Sun, with a new imaging method independently recovering the same ring across eight observations spanning three years

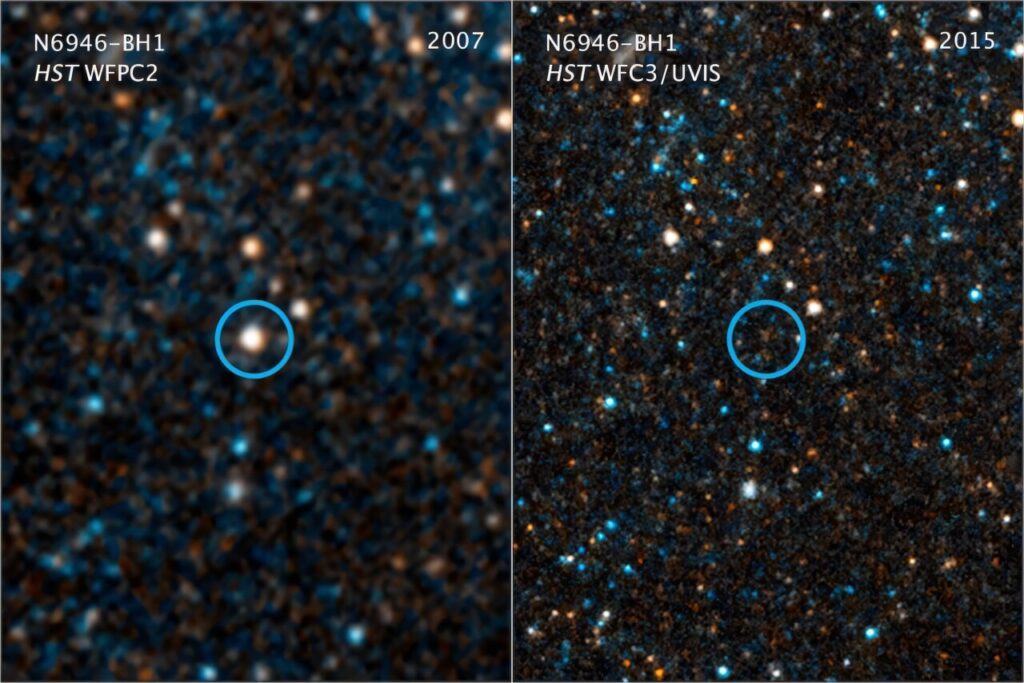
These pictures taken by NASA's Hubble Space Telescope in 2007 and 2015 show an example of a star thought to have died via a failed supernova. The giant star N6946-BH1 is seen before and after it vanished out of sight, likely after imploding to form a black hole. Credit: NASA/ESA/C. Kochanek (OSU)

Black hole mergers cluster around 10 times the Sun’s mass, then plunge by 100-fold before rising again near 16 solar masses, hinting at two distinct populations with different stellar origins

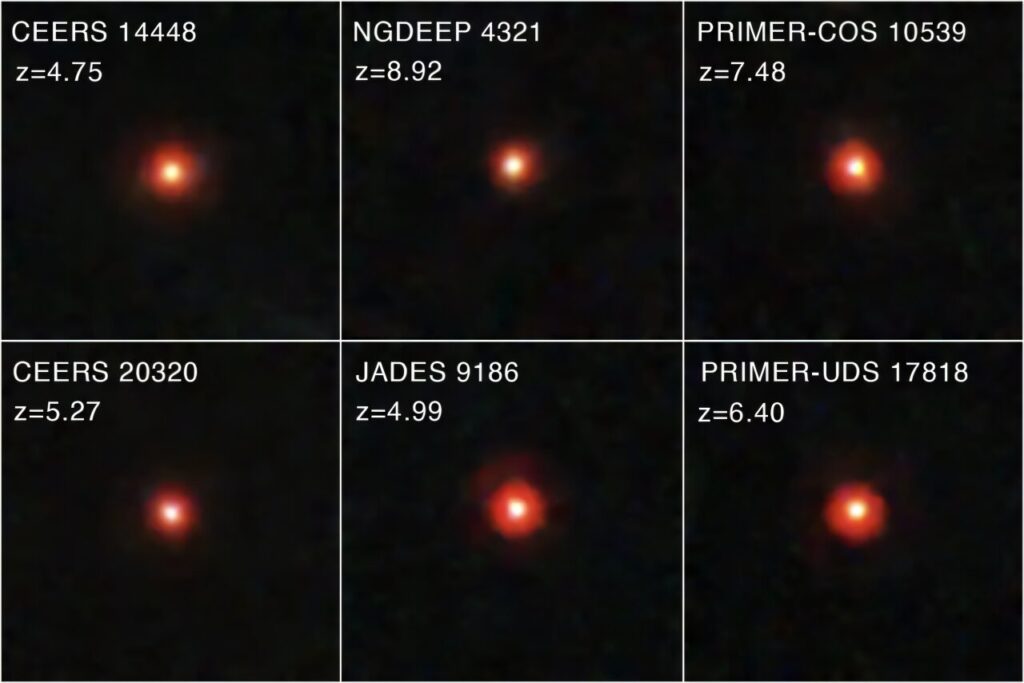
Little red dots images from the James Webb Space Telescope. Credit: NASA, ESA, CSA, STScI, Dale Kocevski (Colby College)

Gas densities exceeding 10 billion particles per cubic centimeter could trap a growing black hole’s X-rays while producing the unusual hydrogen absorption features that make little red dots appear so red

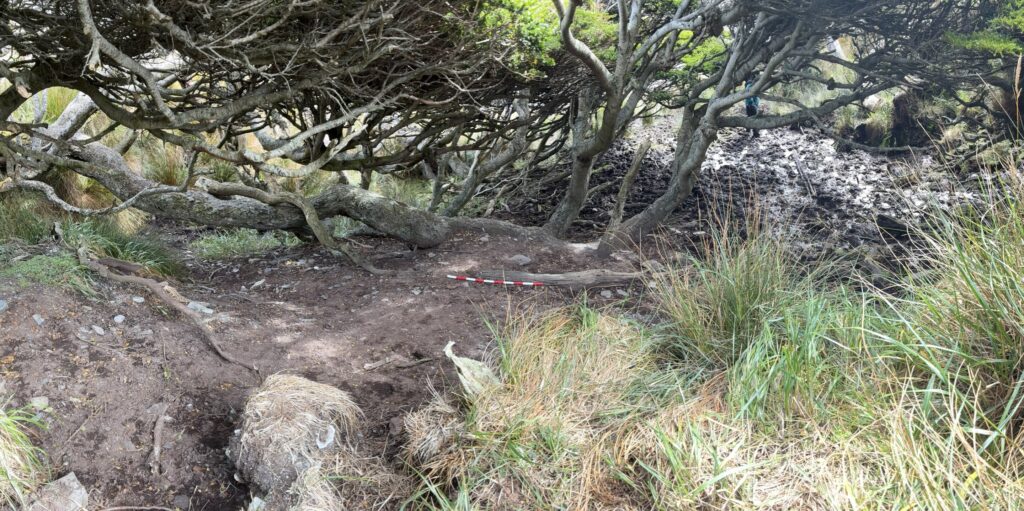
Possible castaway camp site BF008 on Isla de los Estados. Credit: N. C. Ciarlo

Three wooden shipwrecks and a hillside camp emerge on a remote Argentine island, raising questions about the fate of survivors from an 1873 maritime disaster

Paleolithic flint tools, including a handaxe featuring an unusual geological pattern and a tool with an embedded fossil. Credit: Tel-Aviv University

Around 500,000 years ago, ancient humans may have begun keeping unusual stones, fossil-marked handaxes, and weathered tools as personal souvenirs to preserve memories of places and experiences

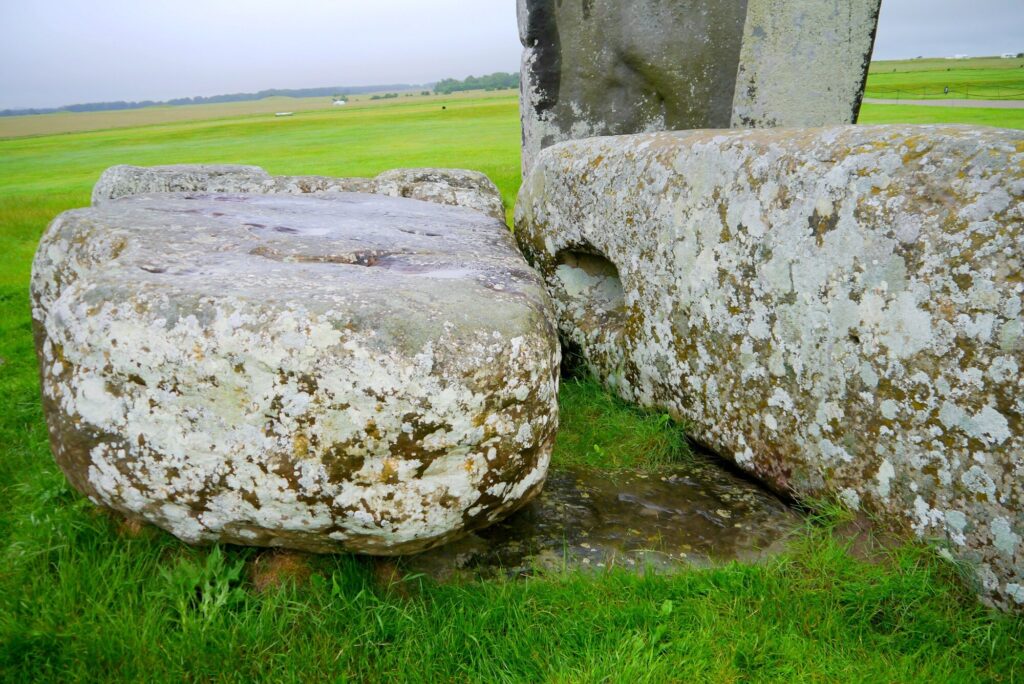
The Altar Stone lies flat on the ground, sunk into the grass beneath the collapsed upright of the Great Trilithon and its lintel. Credit: Professor Nick Pearce, Aberystwyth University

Stonehenge’s six-ton Altar Stone has a geological fingerprint that rules out West Wales and much of northeastern Scotland, but its true birthplace remains unknown

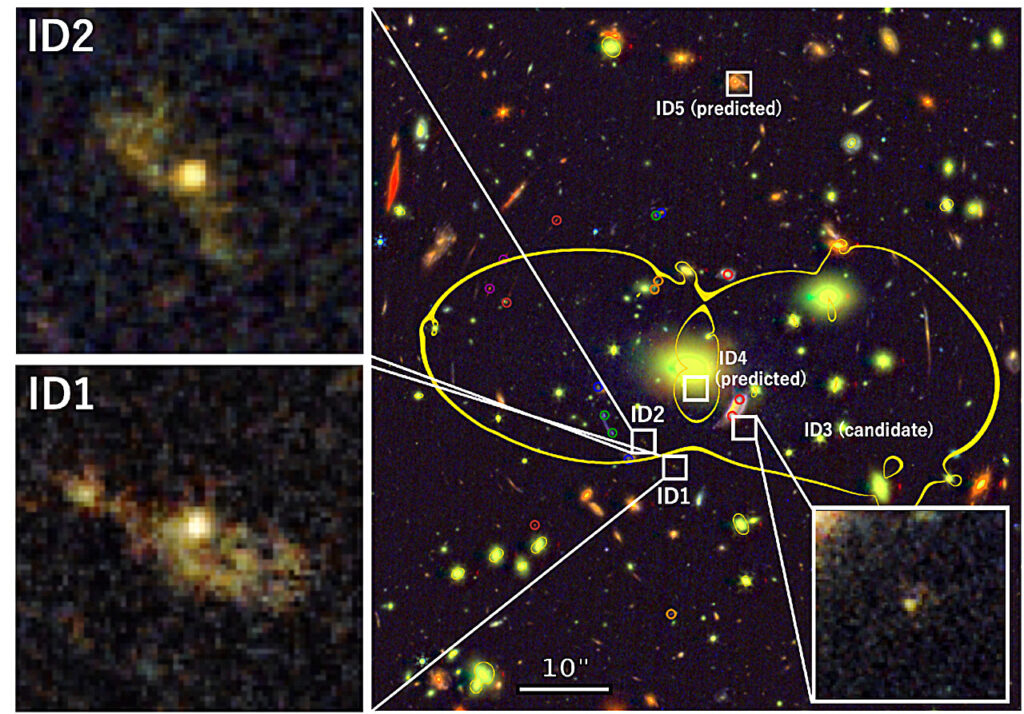
NIRCam RGB color image of the MACS J0257.1-2325 cluster field. The white squares show the positions of ID1–ID5 of the Misty Moons predicted by the independent lens models while the colored circles denote the z ∼ 1–8 multiple image systems used to constrain the lens models. Credit: The Astrophysical Journal (2026). DOI: 10.3847/1538-4357/ae8d09

Seven compact star-forming clumps, each holding millions of suns, crowd a galaxy from just 400 million years after the Big Bang

IDL TIFF file

The early universe expanded three times more slowly in an alternative cosmological model, yet its first light elements could form in almost exactly the same proportions if nuclear reactions and neutron decay slowed at the same rate

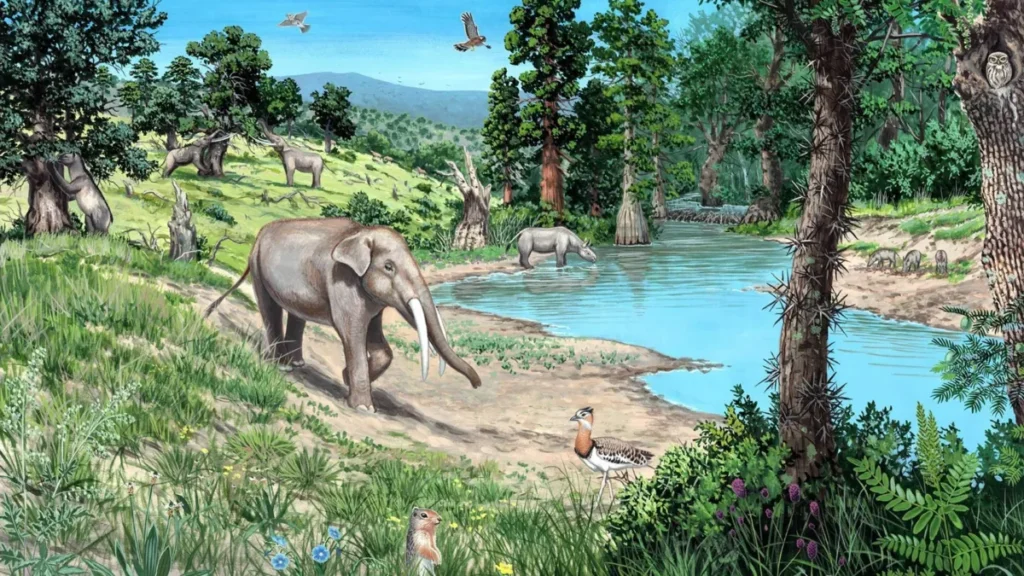
Artist’s reconstruction of what landscapes in Central Europe may have looked like during the Early Late Miocene, according to the study: A semi-open woodland landscape with scattered trees, a flower-rich herb layer and diverse large herbivores such as early elephants, rhinoceroses and horses. Disturbances by herbivores and beavers help maintain a mosaic of woodlands and open habitats. Credit: Márton Zsoldos

Europe’s temperate landscapes may have remained a shifting mosaic of woodland and grassland for 23 million years, with elephants, rhinos and other giant herbivores helping keep trees from taking over

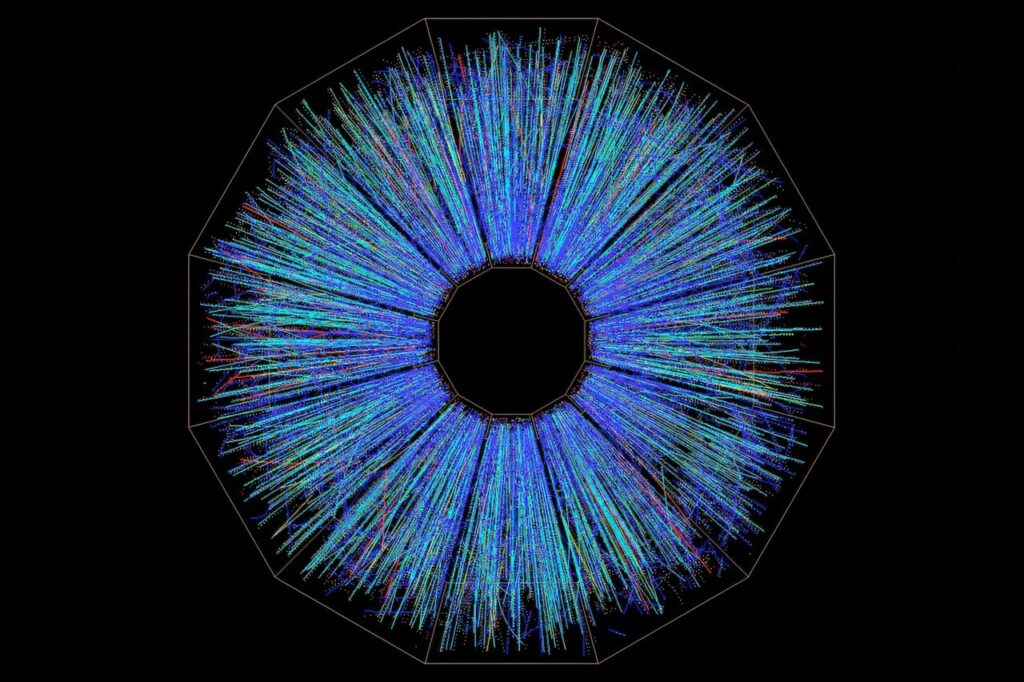
When two beams of gold ions collide at the Relativistic Heavy Ion Collider, they create the quark-gluon plasma. Shortly after the collision, the particles stream out to several detectors. This is the end view from STAR, one of four detectors. Credit: Brookhaven National Laboratory

Heavy quarks in the quark-gluon plasma experience rare, powerful momentum kicks that create asymmetric exponential tails beyond the familiar Gaussian pattern of Brownian motion

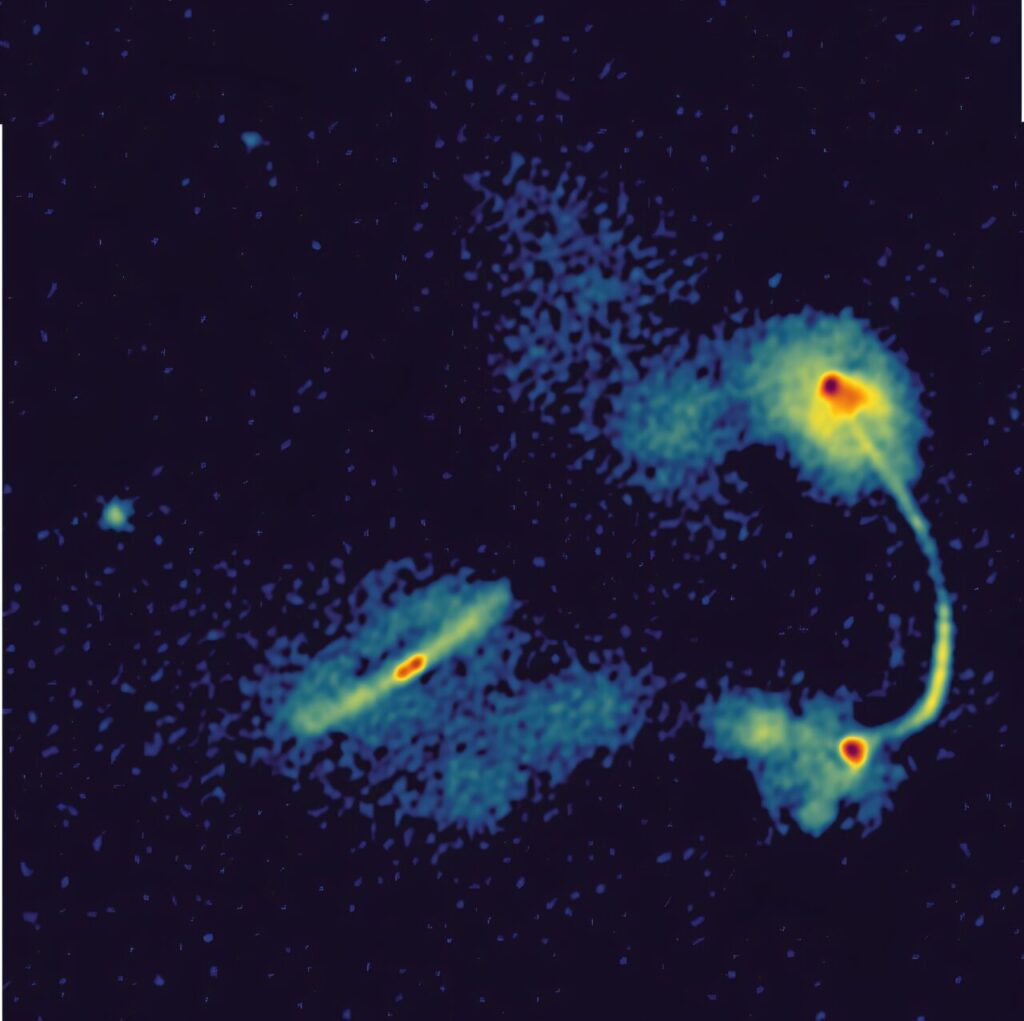
Three galaxies with radio emission. On the left, a compact source whose radio emission originates from active star formation. In the center, a radio jet with a bright core caused by a black hole. On the right, a curved jet. Credit: De Jong et al.

Nearly 63,000 radio sources emerge in the deepest low-frequency images of ELAIS-N1, but some distant galaxies disappear when astronomers zoom in too closely

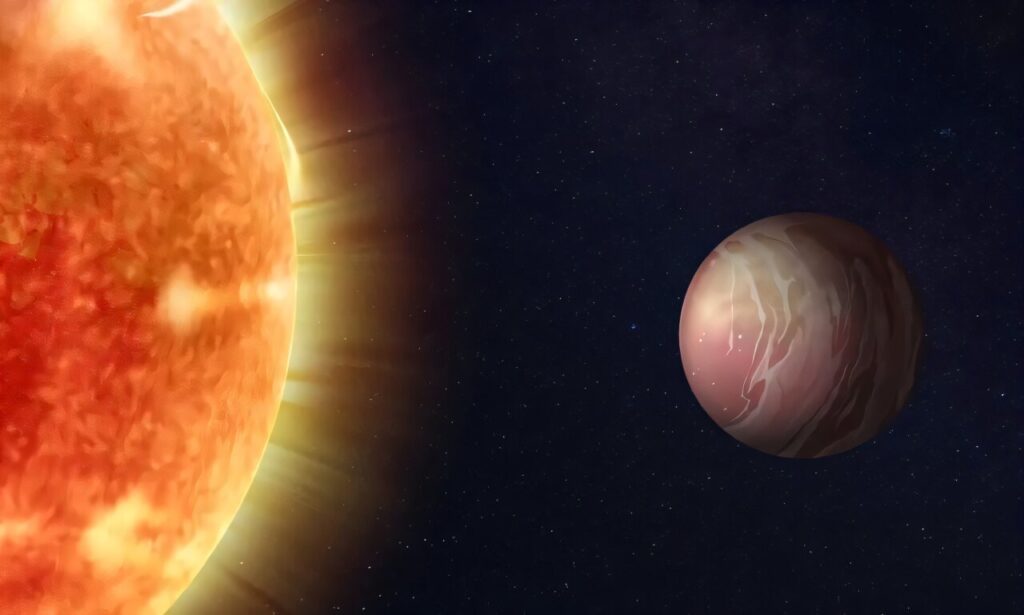
This artist's illustration shows TOI-561 b. It's a super-Earth exoplanet following an ultra-short orbital period around a sun-like star. It was detected in 2020, and due to its proximity to its star, astronomers expected it to have no atmosphere. But new JWST observations show that's not true. Credit: University of Birmingham/CryoDragon Inc.

TOI-561 b has a surprisingly cool dayside and a 1,100 K nightside, pointing to a reflective atmosphere that bounces starlight into space and carries heat around the planet

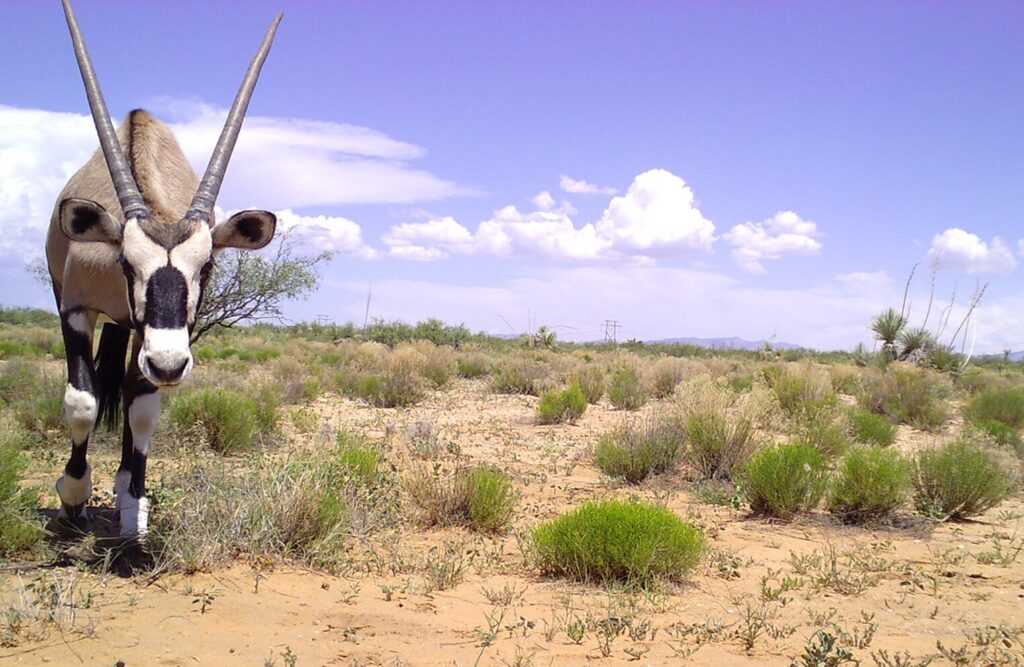
A Gemsbok in an arid, shrub-covered landscape. Climate models project that suitable habitat for introduced Gemsbok could become more extensive and connected across the southwestern United States. Credit: Jornada Basin LTER.

Climate change could connect isolated patches of suitable habitat and help South African gemsbok spread farther across the American Southwest by 2100

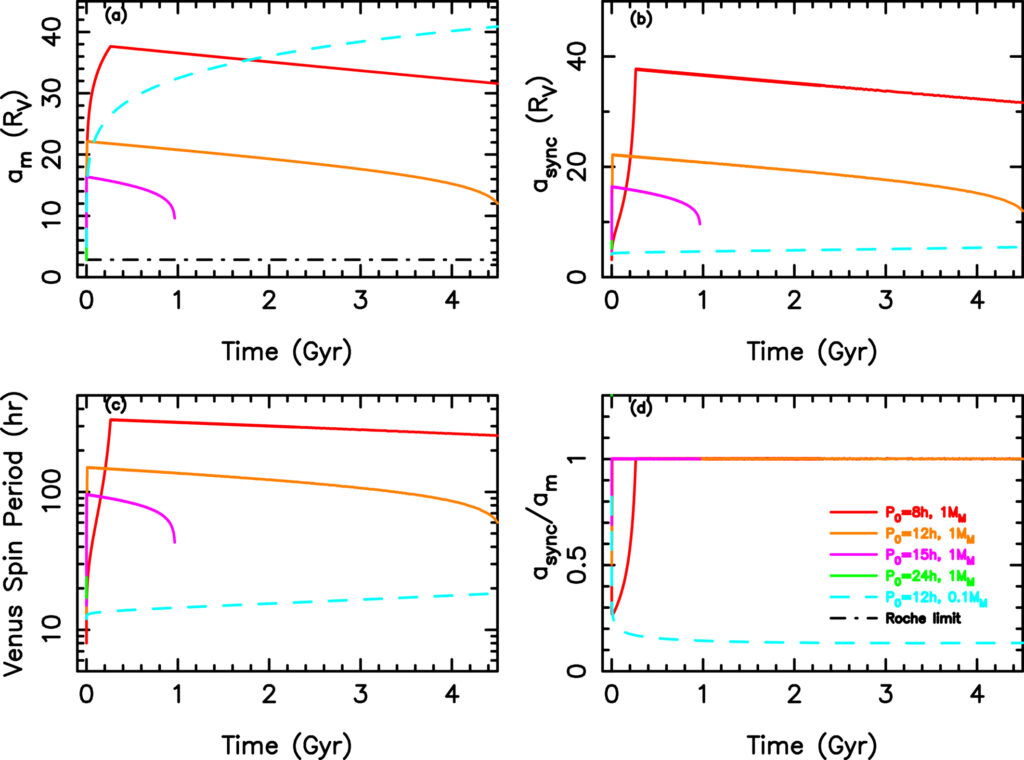
Tidal evolution of a hypothetical Venus moon in the constant-Q model (Qᵥ = 50, aₘ,₀ = 5 Rᵥ). Panel (a) shows the moon’s semimajor axis, panel (b) the synchronous radius, panel (c) the Venus spin period, and panel (d) the ratio of synchronous radius to orbital distance. Five cases are shown: P₀ = 8 hr (red), 12 hr (orange), and 15 hr (magenta) with Mₘ = 1 Mₘₒₒₙ, P₀ = 24 hr with Mₘ = 1 Mₘₒₒₙ (green, destroyed at the Roche limit within ∼1 Myr), and P₀ = 12 hr with Mₘ = 0.1 Mₘₒₒₙ (cyan dashed). The dashed–dotted line in panel (a) marks the Roche limit. For P₀ ≤ 12 hr, the 1 Mₘₒₒₙ satellite survives for 4.5 Gyr, while the P₀ = 15 hr case undergoes synchronous reversal and is destroyed at ∼0.97 Gyr. Credit: The Astrophysical Journal (2026). DOI: 10.3847/1538-4357/ae9d6c

A moon around young Venus could have survived for 4.5 billion years—or spiraled into the planet in less than a million, depending on how fast Venus spun

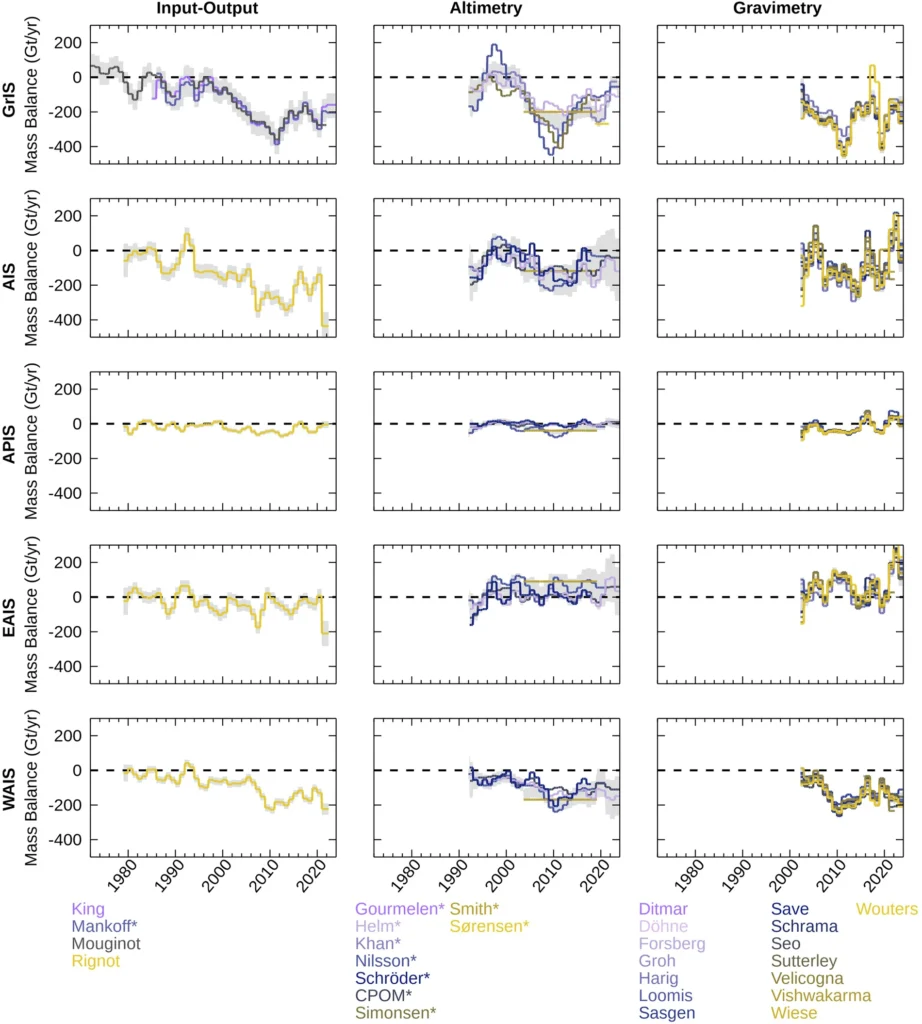
Standardised rates of ice sheet mass balance from the input-output, altimetry, and gravimetry individual estimates over the GrIS, AIS, APIS, EAIS, and WAIS included in this study. The grey shading shows the estimated uncertainty of the aggregated time-series per group. The individual estimates that do not include the peripheral glaciers and ice caps are indicated with an asterisk. Credit: Scientific Data (2026). DOI: 10.1038/s41597-026-08088-0

11.3 trillion tonnes of ice vanished from Greenland and Antarctica from 1979 to 2023, with glaciers and ice streams driving 84% of the loss

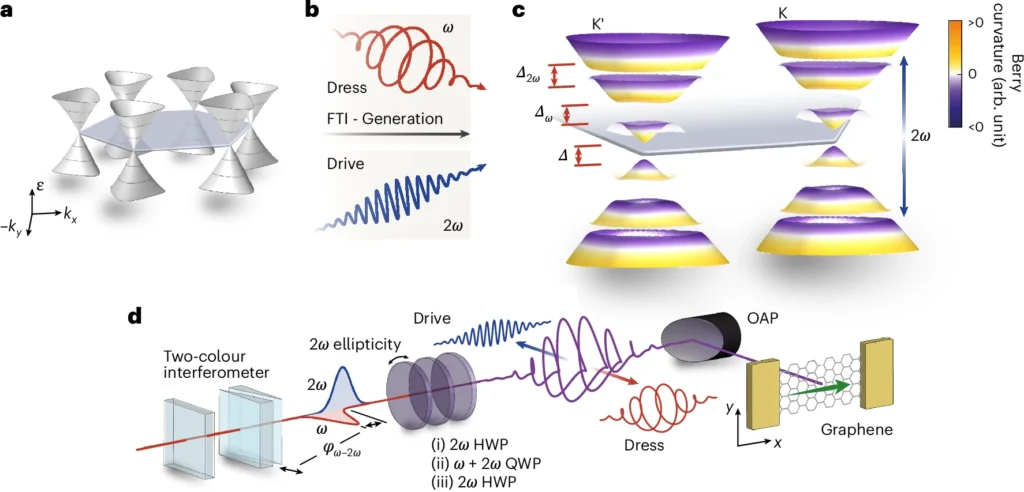
Lightwave control of electrons in a Floquet topological insulator. (a–c) Circularly polarized fundamental laser light drives graphene from its gapless, topologically trivial band structure into a Floquet topological-insulator phase, opening gaps at the K and K′ valleys and generating Berry curvature with the same sign in both valleys. A second-harmonic pulse then controls electron motion in the light-dressed bands, allowing the researchers to probe the Floquet insulating phase through photocurrents associated with circular dichroism and the all-optical anomalous Hall effect. (d) Schematic of the two-color experiment. The relative phase and polarization of the fundamental and second-harmonic pulses are controlled before the combined waveform is focused onto a monolayer graphene strip. Photocurrents are measured through gold electrodes attached to the graphene. Credit: Nature Physics (2026), DOI: 10.1038/s41567-026-03429-7.

Graphene’s light-dressed electrons develop Berry curvature that lets an all-optical Hall current reverse direction, while changing the probe polarization suppresses the response by nearly two orders of magnitude

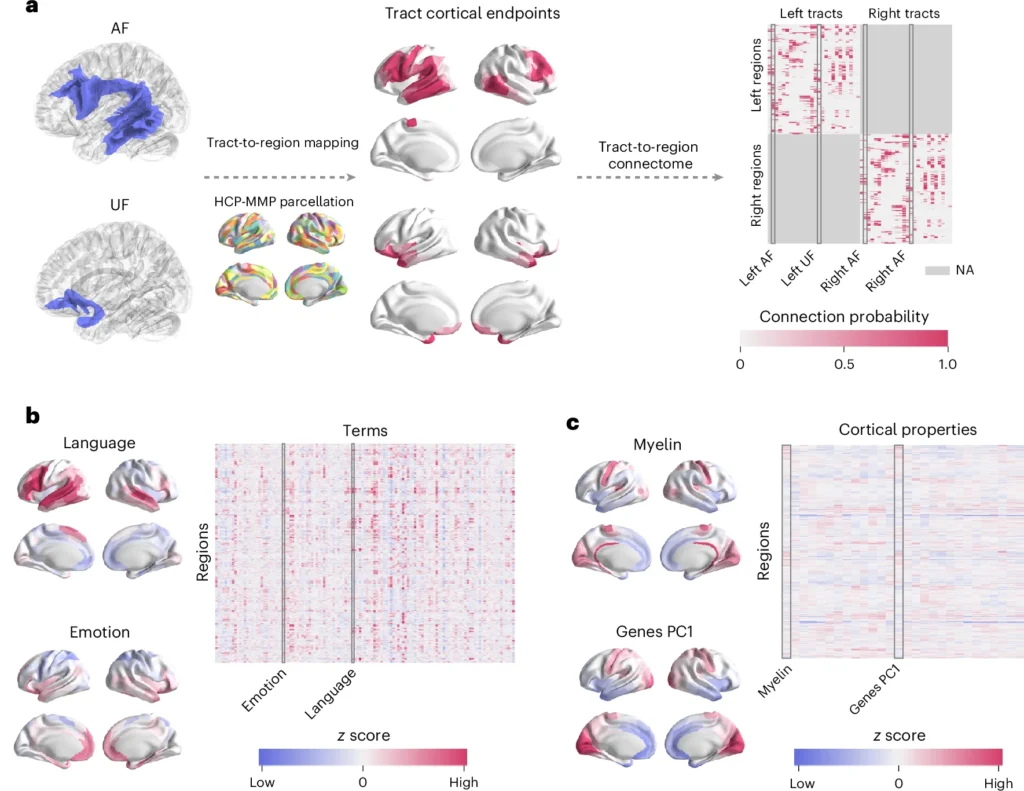
Overview of data types. a, Population-level tract-to-region connectome linking 52 major white-matter (WM) tracts to 360 cortical regions defined by the Human Connectome Project multimodal parcellation (HCP-MMP). Tractography was performed in 1,065 participants from the Human Connectome Project Young Adult (HCP-YA) dataset. For each tract, cortical endpoints were intersected with the 360 HCP-MMP regions and aggregated across participants to estimate the probability of connection between each tract and cortical region, producing a 360 × 52 tract-to-region matrix. Because the analysis focused on within-hemisphere tracts, entries corresponding to contralateral cortical regions were marked as not applicable (NA). The cortical endpoint maps and matrix are illustrated for the arcuate fasciculus (AF) and uncinate fasciculus (UF). b, Cognitive maps based on 125 meta-analytic cognitive terms selected from the Cognitive Atlas and represented in the Neurosynth database, spanning well-characterized lower- to higher-order cognitive processes. Left, example activation maps for ‘Language’ and ‘Emotion’. Right, the resulting 360 × 125 matrix, in which values represent association-test z scores quantifying the extent to which a cortical region was more consistently activated in functional MRI studies that mentioned a given cognitive term than in studies that did not mention the term. c, Biological cortical property maps obtained from Neuromaps and BigBrain. Left, example maps of intracortical myelination (‘Myelin’) and the first principal component of gene expression (‘Genes PC1’). Right, the resulting 360 × 28 matrix, in which values represent z scores of cortical features across the 360 regions. Credit: Nature Human Behaviour (2026). DOI: 10.1038/s41562-026-02559-5

White matter tracts that span more of the brain’s hierarchy connect more biologically different regions and support a wider range of cognitive functions

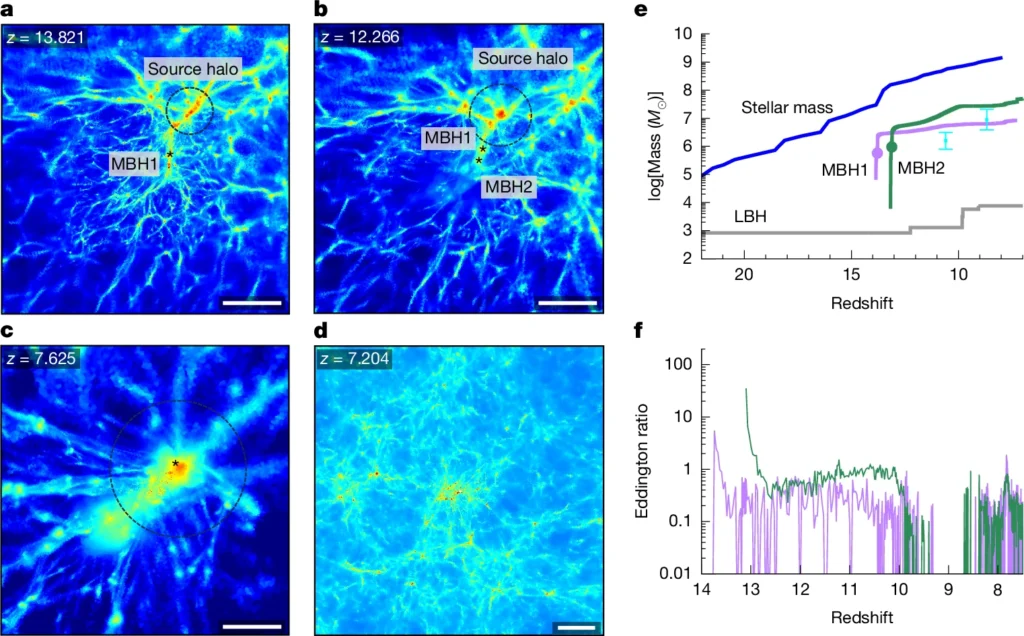
Formation and evolution of massive-seed BHs in the cosmological radiation-hydrodynamic simulation. a–c, Gas density distributions around the target halos at representative epochs. Black asterisks indicate heavy-seed BHs formed through the collapse of supermassive stars. a,b, The epochs when the first (MBH1; a) and second (MBH2; b) heavy seeds form. c, Both MBH1 and MBH2 have migrated into a nearby massive halo and subsequently merged. In a–c, dashed circles mark the neighbouring source halos that provide the strong FUV radiation required for heavy-seed formation. The radii of the circles indicate their virial radii at each snapshot. d, Large-scale gas density distribution across the entire simulated volume (16 h−1 Mpc on a side), centred on the target halo, shown at the final simulation snapshot. e, Redshift evolution of the BH masses and the stellar mass of the source galaxy. The grey line shows the growth of a LBH formed at z ≃ 22 and the purple and green lines correspond to the two heavy seeds (MBH1 and MBH2, respectively). Circles mark the moments when the supermassive stars collapse into BHs. The blue line denotes the total stellar mass of the host galaxy. Cyan points with error bars show observed high-z SMBHs. f, Eddington ratios of the two heavy seeds as a function of redshift. Both MBH1 (purple) and MBH2 (green) undergo short phases of super-Eddington accretion. Scale bars, 100 kpc (a–c); 2 Mpc (d). Credit: Nature (2026). DOI: 10.1038/s41586-026-10985-8

Supermassive stars weighing up to 900,000 Suns collapse into heavy black-hole seeds that rapidly grow to 30 million solar masses in the early universe

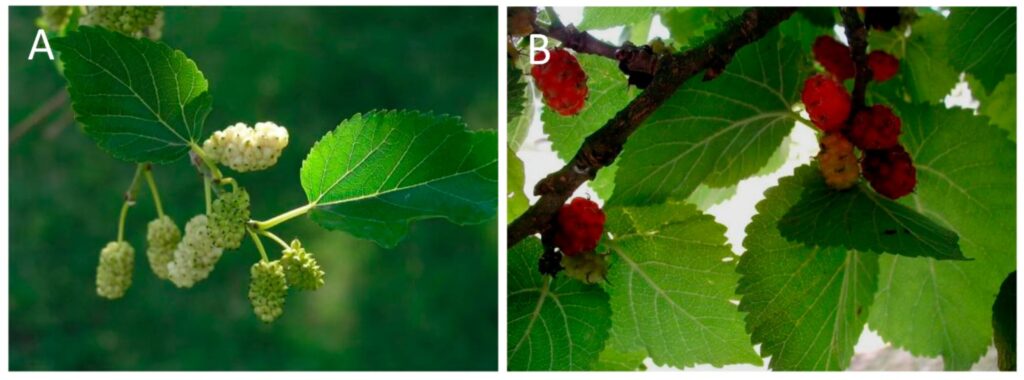
Mulberry species Morus alba (left) and Morus nigra (right), showing differences in leaves and fruit. Credit: Biomolecules (2026). DOI: 10.3390/biom16070965

Mulberry’s effects on the gut can change dramatically with the species, plant part and processing method, from different microbes and short-chain fatty acids to altered intestinal barrier function

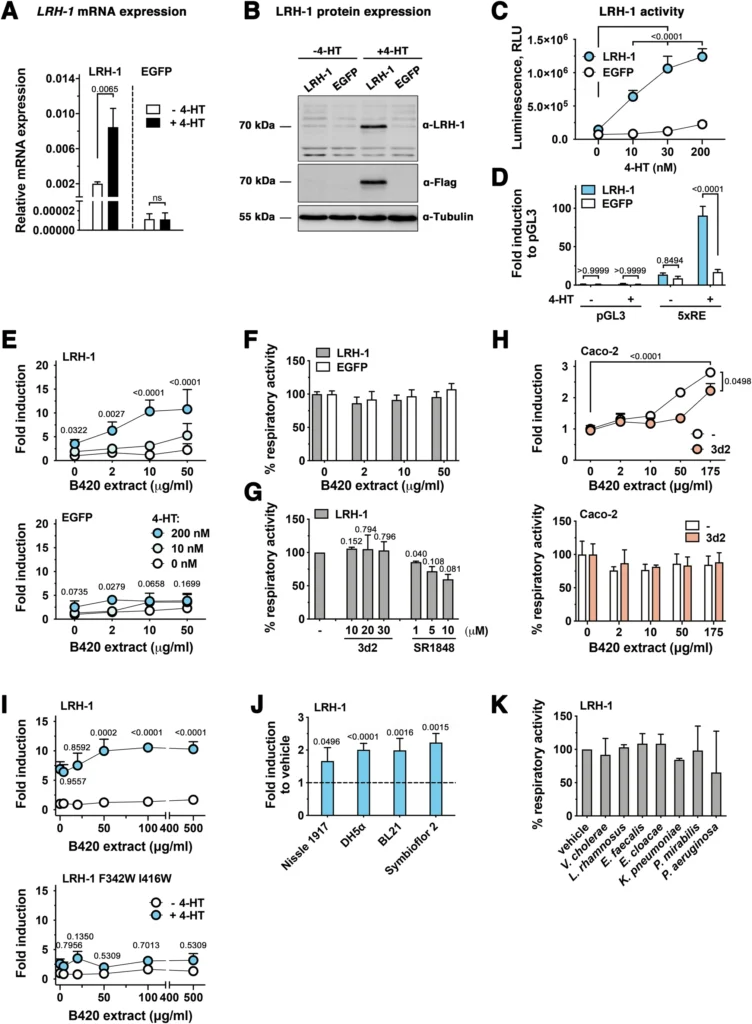
Characterization of the 4-HT-inducible expression system and control experiments related to LRH-1 transactivation. All experiments were performed in LS174T cells, except those shown in panel H. LRH-1 and EGFP cells refer to cells in which human Flagged-tag LRH-1 or EGFP expression was induced by 4-HT treatment (4 h, unless differently indicated). P values are indicated in the figures. (A) Quantification of human LRH-1 mRNA in LRH-1 or EGFP cells. Cells were treated with 4-HT for 6 h and LRH-1 mRNA was measured by RT-qPCR. A representative result showing mean values ± SD of three replicates of two independent experiments is shown. P values were calculated with a two-tailed t test, ns: not significant (P = 0.9514). (B) Immunoblots of human LRH-1 in cell lysates after expression of LRH-1 or EGFP with 4-HT. Cells were treated for 6 h with 4-HT or with its vehicle. LRH-1 expression was detected with anti-LRH-1 or anti-Flag antibodies. Tubulin was used as loading control. (C) LRH-1 transcriptional activity in LRH-1 or EGFP cells after o.n. induction with the indicated concentrations of 4-HT. Mean values ± SD of technical triplicates are shown. Two-way ANOVA, P values compared to vehicle-treated sample are indicated. RLU relative luciferase units. (D) Luciferase activity in LRH-1 or EGFP cells transfected with the pGL3 control vector or LRH-1 reporter. Mean values ± SD. Two-way ANOVA. (E) LRH-1 transcriptional activities in cells with 4-HT-inducible LRH-1 or EGFP expression, stimulated o.n. with B420 extract. Mean values of technical triplicates ± SD of a typical experiment (n = 2) are shown. Two-way ANOVA. (F) Cell viability of LRH-1 and EGFP cells treated with increasing concentrations of B420 extracts. Respiratory activity as measured by MTT is shown (mean ± SD of a representative experiment, n = 3). Comparison of all means by two-way ANOVA revealed no significant differences among any of the groups (all P > 0.1609). (G) Cell viability (MTT assay) of LRH-1 cells treated with the LRH-1 inhibitors 3d2 or SR1848. Mean values ± SD of a representative experiment (n = 2) are shown. Paired two-tailed t tests were performed to compare each treatment with the control (−). (H) Transcriptional activities of endogenous LRH-1 and cell viability (respiratory activity, MTT assay) in Caco-2 cells stimulated with B420 extracts in the absence or presence of the LRH-1 inhibitor 3d2. Mean ± SD (n = 2). Two-way ANOVA analysis. Comparison of all cell viability means revealed no differences among any of the groups (all P > 0.5292). (I) LRH-1 transcriptional activities in LS174T with 4-HT-inducible expression of wild-type LRH-1 or LRH-1 F342W/I416W stimulated with increasing doses of B420 extract. Mean ± SD of one experiment performed in triplicates. Two-way ANOVA (comparison of mean values of B420 treatments to vehicle-treated control, +4-HT group). (J) Effect of lipid extracts (50 μg/mL) from different E. coli strains on LRH-1 transcriptional activity in LRH-1-expressing LS174T cells. Mean ± SD of at least three independent experiments performed in technical triplicates. Unpaired two-tailed t tests were performed to compare each treatment with the control. (K) Cell viability (MTT assay) in LRH-1-expressing LS174T cells treated with lipid extracts from bacterial strains indicated (200 μg/mL). Credit: EMBO Molecular Medicine (2026). DOI: 10.1038/s44321-026-00516-3

Vaccenic acid from bacterial lipids binds LRH-1 directly, lowering blood glucose and improving fatty liver measures in obese mice

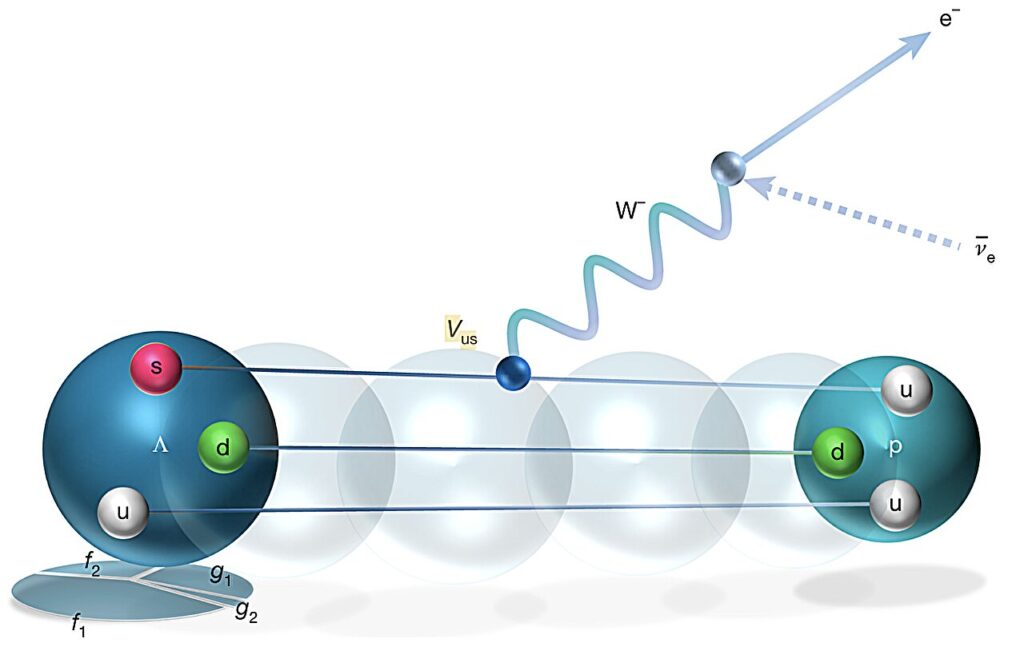
Schematic representation of the Λ decay to a proton, an electron and an electric antineutrino through virtual (mediating) W− boson. The pie chart shows the relevant magnitudes of the dominant vector and axial-vector form factors partaking in the transition. Credit: Nature (2026). DOI: 10.1038/s41586-026-10818-8

Two entangled Lambda baryons turned a difficult weak decay into a multidimensional probe of quark mixing, yielding a new |Vᵤₛ| measurement and the first weak-electricity result for the decay

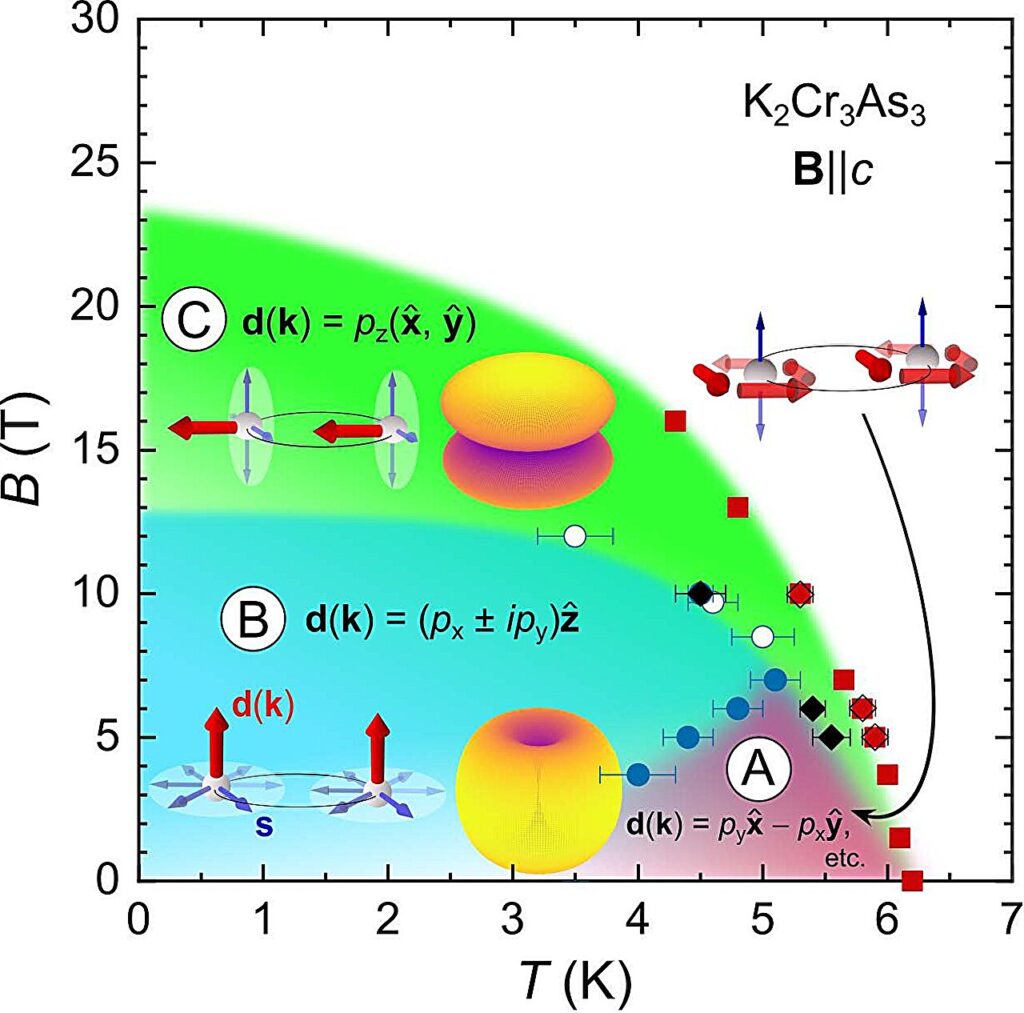
Multiple superconducting phases of 
K
2
​
Cr
3
​
As
3
 for 
𝐁
∥
c
. The 
T
c
 values, represented by red squares and open diamonds, were determined by ac susceptibility and 1/
T
1
 measurements. The characteristic temperatures 
T
∗
, represented by blue circles (open and filled) and black diamonds, were determined from the Knight shift and/or 1/
T
1
 measurements. The errors in 
T
∗
 represented by blue circles were estimated by assuming that the uncertainty is equal to the point (temperature) interval around the position indicated by the dashed arrow in Fig. 2(a). The errors in 
T
∗
 represented by black diamonds were estimated from the 1/
T
1
 measurement temperature interval. The illustrations within Phases A/B and C display the superconducting gap functions with a linear combination of 
p
x
 and 
p
y
 [
Δ
(
θ
, 
ϕ
) = 
Δ
0
sin
⁡
θ
​
e
i
​
ϕ
] and for the 
p
z
-wave [
Δ
(
θ
, 
ϕ
) = 
Δ
0
cos
⁡
θ
​
e
i
​
ϕ
], respectively. See also Fig. 6 in the End Matter for the spin structure of each phase. Credit: Physical Review Letters (2026). DOI: 10.1103/kykd-2nj4.

Cooling and increasing the magnetic field send K2Cr3As3 through three superconducting states, from a helical point-node phase to a chiral point-node phase and finally a line-node phase

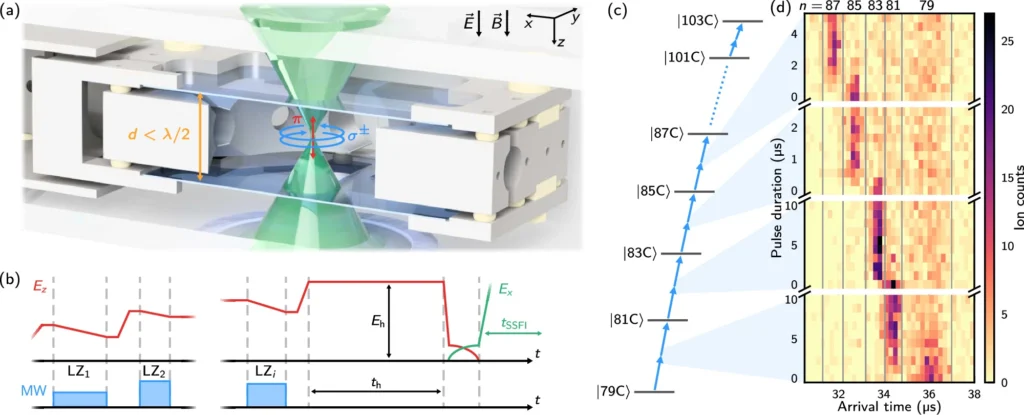
Suppression capacitor and coherent high-n circular state control. a Experimental setup: A circular Rydberg atom is trapped in an optical tweezer at the center of an electrode structure. This structure consists of four ring-shaped electrodes in the xy-plane in between two indium tin oxide (ITO)-coated glass plates, the latter forming the capacitor with spacing d for suppression of σ± polarized blackbody radiation modes of wavelength λ. Applied electric and magnetic fields along z (quantization axis) orient the circular Rydberg orbit so that it lies in the xy-plane. b Sketch of the succession of Landau-Zener microwave (MW) pulses (LZᵢ) and the electric field sequence (Ez) applied for preparing CRS up to n = 103 starting from |79C⟩. Each pulse LZᵢ drives a two-photon transition in the simplified level scheme depicted in c, while Ez is ramped linearly across the resonance condition for coherent Landau-Zener population transfer. After a hold time th at a fixed field Eh, the final Rydberg state is detected via state-selective field ionization (SSFI) by applying a large field Ex ramp. d SSFI measurements of Landau-Zener sweeps of four exemplary transitions up to n = 87, showing adiabatic transfer (|nC⟩ ↔ |n + 2C⟩) when the LZᵢ pulse duration is sufficiently long.  Credit: Nature Communications (2026). DOI: 10.1038/s41467-026-77764-x

Single strontium atoms survived 11.5 milliseconds in room-temperature circular Rydberg states—21 times longer than in free space

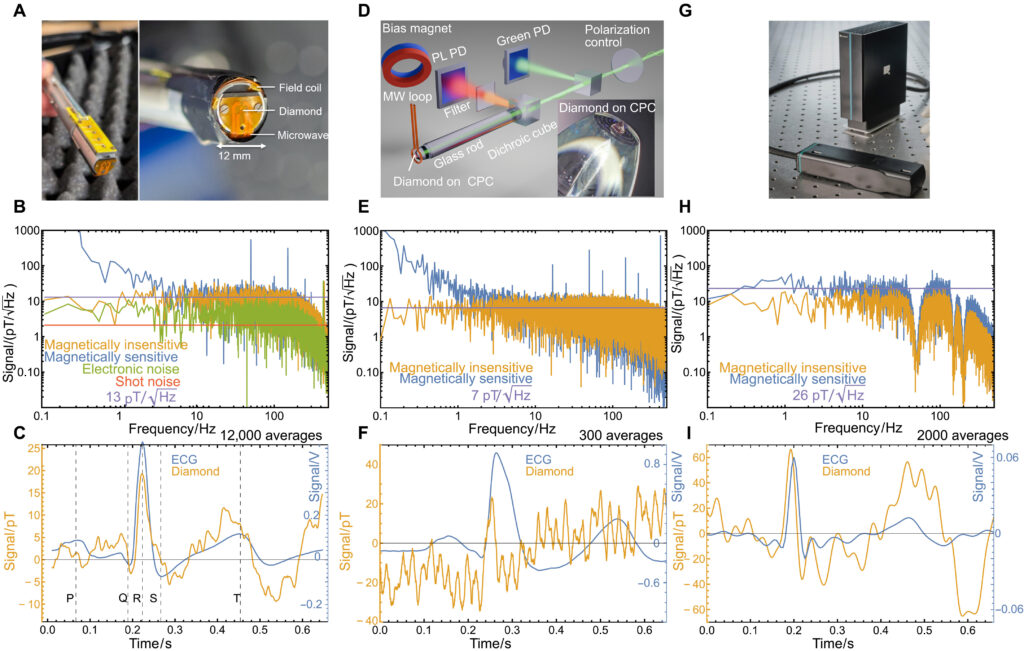
NV-based magnetic sensors, sensor characterization, and detected MCG signals. First column: JGU. (A) Diamond sensor head dimensions. (B) Amplitude spectral density with a baseline of 13 pT/√Hz, measured inside the shielded room of the Helmholtz Institute Mainz (JGU). (C) ECG trace and diamond MCG signal (12,000 averages) with indications of the main components of the ECG, P wave, QRS complex, and T wave. Second column: ZAQuant. (D) Rendering of the sensor, created in Blender (45). PD, photodiode; PL, photoluminescence. For a description of the parts refer to the main text. (E) Measured amplitude spectral densities inside the partially shielded environment, showing a noise baseline of 7 pT/√Hz. (F) ECG trace and averaged diamond MCG signal (300 averages). Third column: Q.ANT. (G) Sensor design. (H) Amplitude spectral density with a baseline of 26 pT/√Hz; filters were applied during acquisition. (I) ECG trace and diamond MCG signal (2000 averages). Credit: Science Advances (2026). DOI: 10.1126/sciadv.aeg5281

Tiny diamond sensors detected the heart’s faint magnetic field from about a centimeter away, but only after thousands of heartbeats were averaged to separate the signal from noise

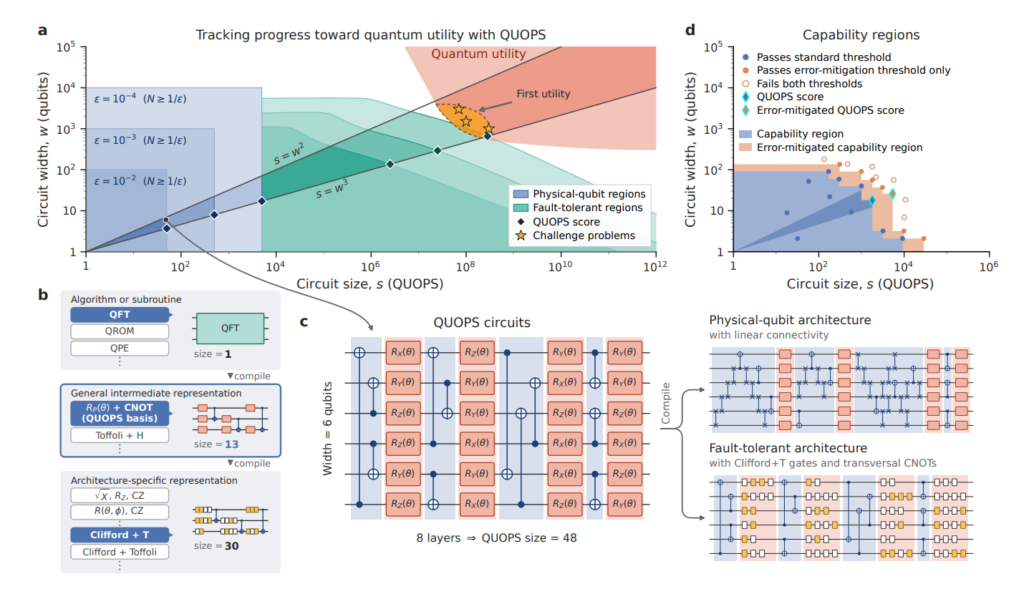
QUOPS tracks progress toward quantum utility. (a) Solving useful and classically intractable problems (red region) requires executing quantum circuits with large width w (number of qubits) and size s (number of gates). Circuits for canonical challenge problems (stars) indicate where first utility is likely to be achieved. A computer’s computational capability is represented by its capability region (blue and green regions): the shapes of the circuits it can execute successfully. Its QUOPS score is the largest successful circuit size within the cone w² ≤ s ≤ w³. (b) Circuit size depends on the gate basis used. QUOPS uses medium-complexity gates that often appear in algorithms and must be compiled to each architecture. (c) QUOPS circuits consist of alternating layers of random single-qubit Rₚ(θ) rotations (orange) and CNOT gates (blue) on w qubits. Executing QUOPS circuits involves architecture-specific compiling and routing. (d) Capability regions are measured by estimating the mean polarization of random QUOPS circuits using mirror circuit fidelity estimation, a technique that enables efficient polarization estimation even for classically hard circuits. Blue circles denote shapes passing a standard threshold, mean polarization ≥ 1/√e, with 95% confidence. Hollow circles denote failures. Error-mitigated capability regions (orange) indicate circuits from which information could be extracted with a predicted sampling overhead of approximately 1/α² (captured by the QUOPS rate throughput metric). They are defined by circuit shapes whose estimated mean polarization exceeds a lower threshold α < 1/√e (orange circles). Credit: arXiv (2026). DOI: 10.48550/arxiv.2609.12146

Current quantum processors can run circuits rated at hundreds to about 1,500 QUOPS, but proposed RSA-2048 factoring and FeMoco simulations require roughly 250 million to 340 million—leaving a gap of about five orders of magnitude

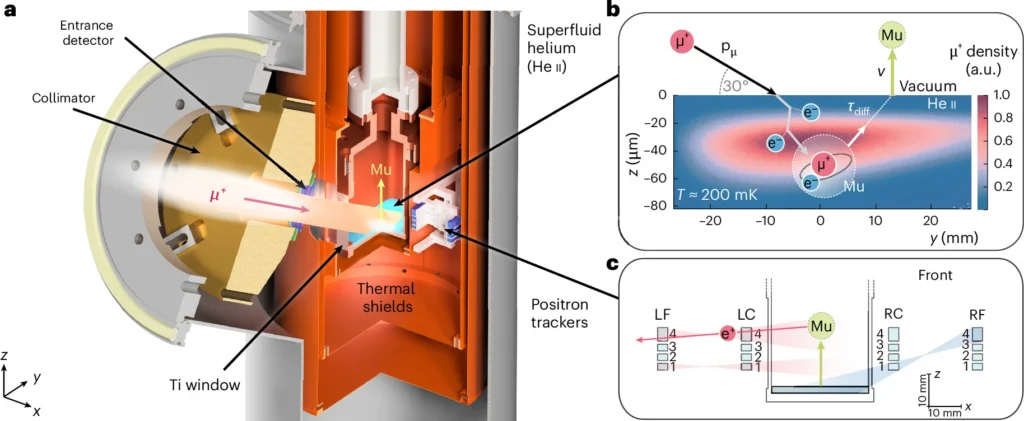
a, A collimated μ+ beam traverses an entrance detector and several thin foils before stopping in a thin horizontal layer of superfluid helium (He II). The He II target chamber is mounted to the mixing chamber plate of a dilution refrigerator and surrounded by three layers of thermal shields. b, Principle of Mu stopping and formation in He II at a temperature of T ≈ 200 mK. Incoming μ+ with momentum pμ come to rest in an average 35-μm depth (coloured gradient in the background shows the simulated stopping distribution) and capture an electron from the ionization trail. The formed Mu diffuses ballistically to the surface over a time τdiff and is emitted perpendicularly with a velocity v defined by the chemical potential. c, Schematic of the positron-tracking system used to localize Mu and μ+ decays within the target chamber. Detector segments (blue boxes) are labelled using their relative position to the He II target as left (L), right (R), close (C) and far (F) detectors. Shaded areas indicate the acceptance regions of selected detector coincidences: red areas denote coincidences of Layers 1 and 4 on the left side (LC1 ∧ LF1, LC4 ∧ LF4), whereas blue denotes a coincidence (RC1 ∧ RF4) monitoring the target liquid. Credit: Nature Physics (2026). DOI: 10.1038/s41567-026-03433-x

Muonium atoms emerge from superfluid helium at about 2,180 meters per second in a tightly directed beam that could make precision gravity and spectroscopy experiments far more practical

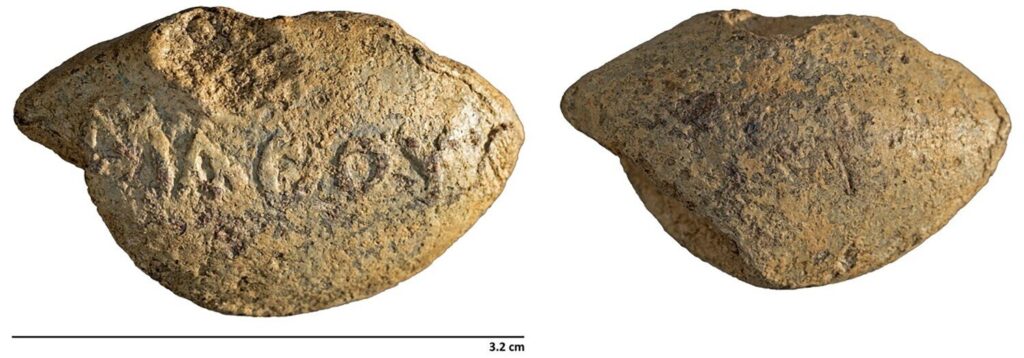
Inscribed sling bullet (B19655) found at Hippos with the inscription ΜΑΘΟΥ, meaning "Learn your lesson!" Credit: Eisenberg et al. 2026

One lead projectile fired at ancient Hippos was inscribed with “Learn your lesson!” and still bears the scar of impact

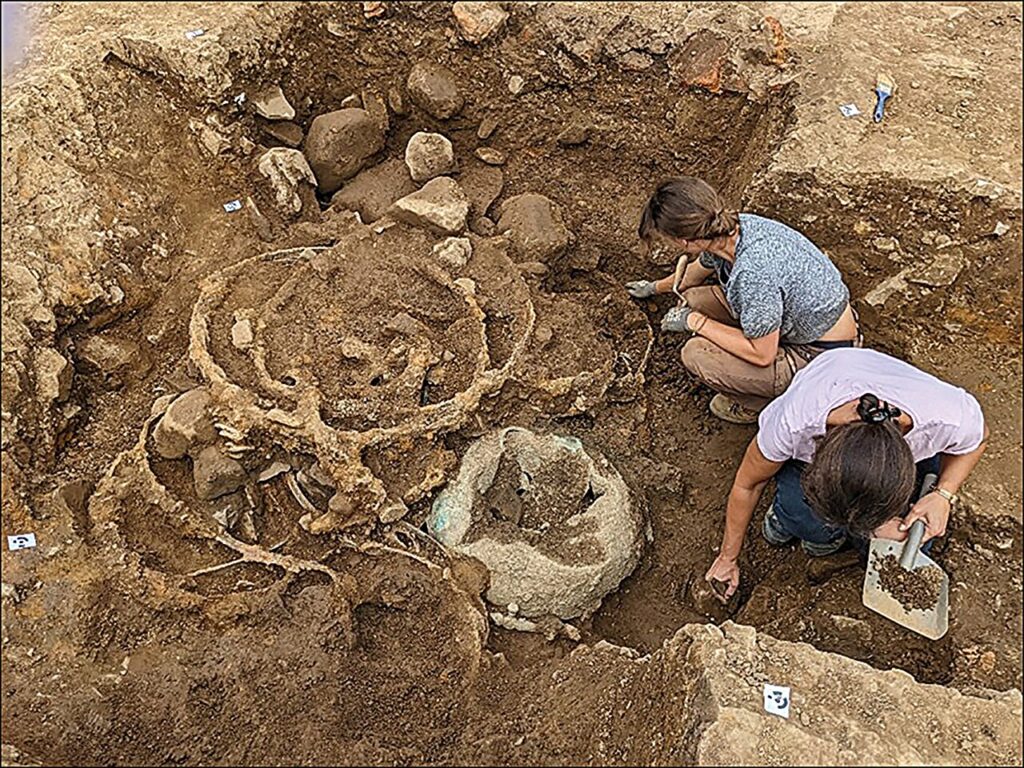
The deposit of iron tires in Trench 1 shortly after being uncovered. Credit: Durham University

More than 950 Iron Age objects buried near a British power center include parts from at least seven substantial four-wheeled wagons

Artist’s impression of the glacial landscape encountered by Neanderthals during the Ice Age. Credit: Direction de l’archéologie du Pas-de-Calais/Benoît Clarys

Around 75,000 years ago, harsh Ice Age conditions pushed Neanderthals into southwestern Europe, where a surviving lineage later spread across the continent

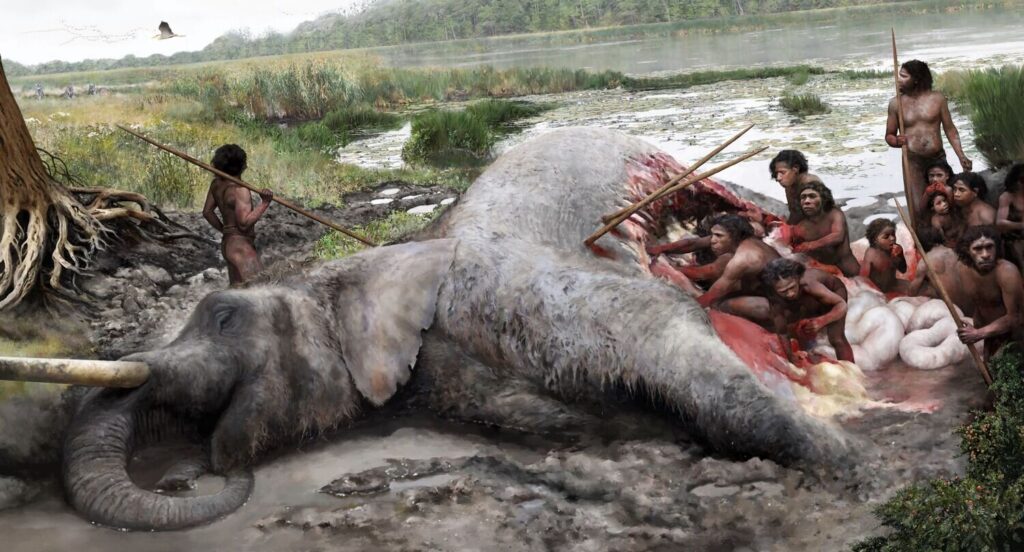
This illustration gives an idea of how Neanderthals would have butchered an elephant: they used flint tools to break open the thick elephant skin and then remove the organs and meat. Hunting a male elephant like this could have only been successful as a well-organised group. Credit: Tom Björklund, Lower Saxony State Office for Heritage (NLD)

A 125,000-year-old wooden spear lodged between an elephant’s ribs now sits alongside cut marks showing Neanderthals killed and butchered the 3,500-kilogram animal at a German lakeshore

Emerald found in Tomb T4 at El Caño, placed in the belly of a female copper figure (AD 800–1000). Credit: C. Mayo Torné

More than 700 kilometers from Colombia, emeralds reached elite Panamanian tombs after passing through an unknown chain of communities

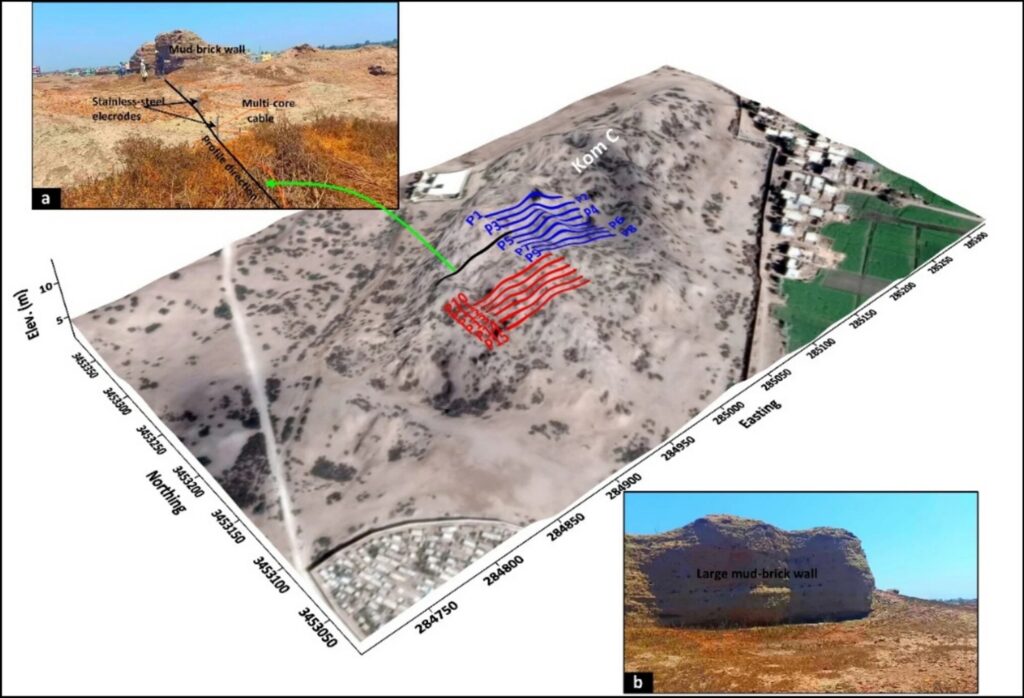
Site geometry and layout of the ERT survey. The first set of 2D ERT profiles is represented by blue lines (Group A), while the second set is denoted by red lines (Group B), with profile IDs labeled accordingly. a and b feature field photographs illustrating the arrangement of 2D ERT profiles and a significant mudbrick wall, dating back to the Late Roman Period, respectively. Credit: Acta Geophysica (2026). DOI: 10.1007/s11600-026-01809-4

2,600-year-old structure lies 3 to 6 meters beneath ancient Egypt’s Buto, where scans found mudbrick walls and religious artifacts
1 2 … 4 →
  • About Us
  • Contact Us
  • Privacy Policy
  • Terms of Service
  • Editorial Policy
  • Copyright Policy

© 2026 TuhinNova. All Rights Reserved.