Seven dense clumps of stars crowd the interior of a distant galaxy that existed when the universe was only about 400 million years old. Known as Misty Moons, the galaxy appears in two magnified images captured by the James Webb Space Telescope, revealing at least seven compact stellar regions that would be difficult to distinguish without gravitational lensing. Each clump contains an estimated 7 million to 13 million solar masses of stars, and together they may hold a substantial share of the galaxy’s stellar mass. The finding points to an unusually concentrated pattern of star formation in the early universe, unlike the more dispersed stellar structures commonly seen in nearby dwarf galaxies.
The galaxy, estimated to lie at a redshift of approximately 11–12, is located behind a massive galaxy cluster called MACS J0257.1-2325. Its light has traveled for more than 13 billion years before reaching Earth, carrying information about a period when galaxies were still in their earliest stages of development.
What makes the Misty Moons particularly interesting is not simply its age or distance. It is the structure that astronomers can see inside it. Instead of appearing as one smooth collection of stars, the galaxy breaks into several distinct, compact regions of intense star formation.
Ordinarily, such small structures would be extremely difficult to distinguish in a galaxy this distant. But the gravity of the foreground galaxy cluster magnifies the background galaxy, making its internal features visible in much greater detail.
The observations reveal a system in which relatively small stellar clumps appear to dominate the overall mass budget. The researchers also find that these regions have high stellar densities and young stellar populations, although the precise sizes of the smallest clumps and the physical processes responsible for their formation remain uncertain.
A distant galaxy magnified by a foreground cluster
The Misty Moons was identified through the James Webb Space Telescope’s VENUS Treasury Survey, short for Vast Exploration for Nascent, Unexplored Sources. The observations targeted the galaxy cluster MACS J0257.1-2325, which lies at a redshift of 0.505.
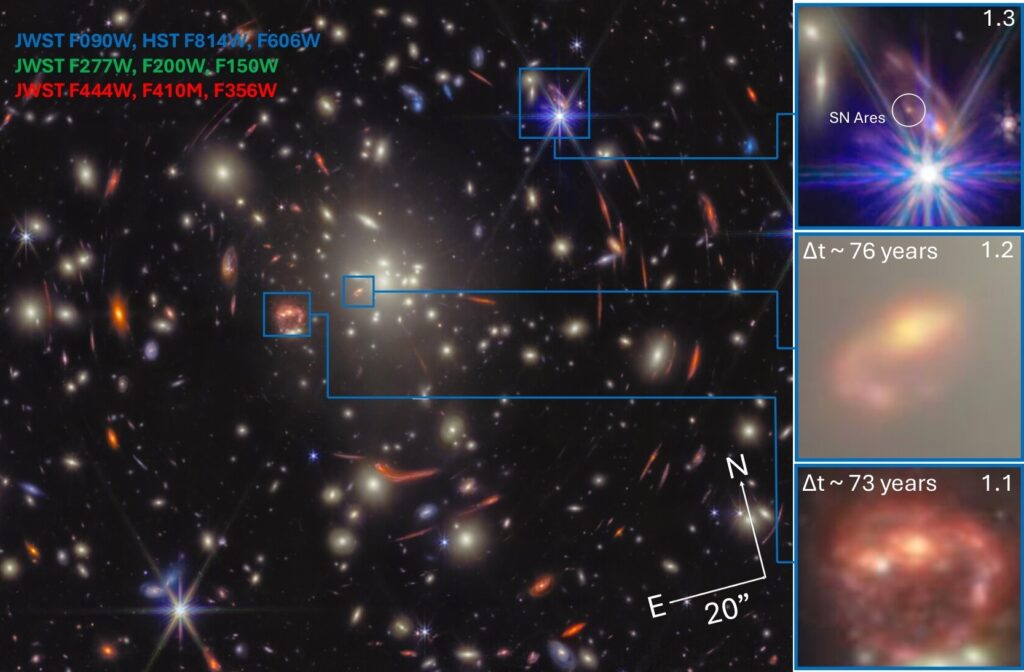
The cluster acts as a gravitational lens. Its enormous mass bends the paths of light traveling from objects behind it, magnifying and distorting their apparent images.
This effect, known as strong gravitational lensing, allows astronomers to investigate galaxies that would otherwise be too faint or too small to study in comparable detail.
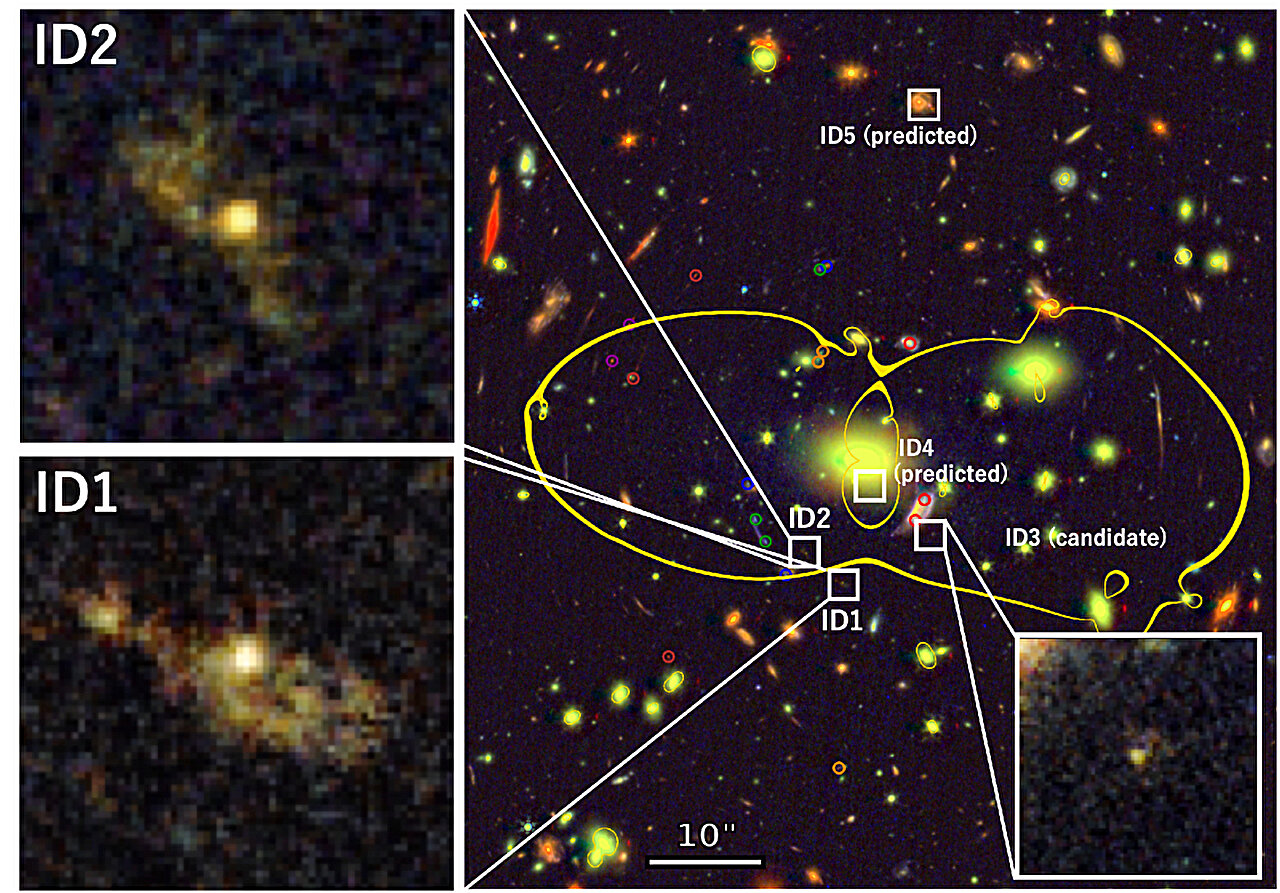
In this case, the lensing cluster is predicted to produce five separate images of the same background galaxy. These are different apparent views of one distant object, not five individual galaxies.
Two of the predicted images, designated ID1 and ID2, are clearly detected. Both are exceptionally bright in the JWST images, with an apparent brightness of approximately 26 AB magnitudes in the F200W filter.
The lensing magnification is estimated to be approximately 20–30 times for these two images, depending on the model used.
A third possible image, ID3, is also identified. However, the researchers do not detect the remaining two predicted images, ID4 and ID5. Their expected brightness is approximately 29 magnitudes in F200W, roughly one magnitude fainter than the observations’ five-sigma detection limit of about 28 magnitudes.
The absence of these two images is therefore consistent with their predicted low magnifications. Deeper JWST observations would be needed to identify them.
The two clearly detected images are particularly useful because they provide separate views of the same galaxy. Despite the distortions introduced by gravitational lensing, their reconstructed internal structures and the relative positions of their stellar clumps are remarkably similar.
This agreement supports the interpretation that the features identified in both images belong to the same underlying galaxy.
The galaxy’s age is estimated from its disappearing ultraviolet light
Determining the distance of an extremely early galaxy is not as straightforward as measuring the distance to a nearby star. The researchers therefore used the galaxy’s light across multiple wavelengths to estimate its photometric redshift.
They combined observations from 10 JWST/NIRCam filters with earlier images from the Hubble Space Telescope. The data covered wavelengths ranging from the optical through the near-infrared.
The two detected images have a particularly important characteristic. Their light drops sharply at wavelengths shorter than approximately 1.5 micrometers, producing what astronomers call a dropout.
This happens because hydrogen absorbs ultraviolet light at specific wavelengths. As the universe expands, light traveling through space is stretched toward longer wavelengths. For sufficiently distant galaxies, the resulting absorption feature shifts into the infrared part of the spectrum.
The position of this sharp change in brightness helps astronomers estimate how far away the galaxy is.
The researchers also examined the galaxy’s spectral energy distribution, or SED. This describes how much light an object emits at different wavelengths and provides information about its distance and stellar populations.
They used two independent fitting approaches, EAZY and Prospector, to examine the observations.
The results depended partly on whether the models included possible emission from hydrogen’s Lyman-alpha line, known as Lyα emission.
Without this emission, the best-fitting models placed both images at a redshift of approximately 11. Including it shifted the estimates toward redshift 12.
The researchers could not statistically exclude either possibility based on the differences in the fitting results.
Nevertheless, both images have very blue ultraviolet spectral slopes, measuring β = −2.41 ± 0.20 for ID1 and β = −2.60 ± 0.23 for ID2. Their lack of detections at shorter wavelengths also strongly supports a redshift greater than 10.
The resulting probability of the galaxy lying beyond redshift 10 is approximately 1.0 in their photometric analysis.
An important qualification is that the redshift has not been confirmed through spectroscopy. The estimated range of 11–12 comes from fitting the observed light rather than directly measuring a spectroscopic redshift.
The researchers therefore adopted a redshift of 11.5 when analyzing the galaxy’s stellar populations.
Seven clumps emerge after correcting for gravitational lensing
The most striking details become visible when the astronomers reconstruct the galaxy’s appearance without the distortions caused by the foreground cluster.
They first combined images from four JWST filters, F200W, F277W, F356W and F444W, to create a detection image with a stronger signal than any individual filter could provide.
They then separated the bright, compact features from the smoother underlying light.
To do this, they smoothed the original image using a Gaussian filter and subtracted the smoothed version from the original. This process reduced the contribution of extended light and made smaller structures easier to identify.
The researchers used the resulting contrast images to locate individual clumps.
Four were identified in ID1, labeled A.1, B.1, C.1 and D.1. Three were identified in ID2, labeled A.2, B.2 and C.2.
The seven detections were visible across almost all the observed filters at wavelengths longer than 1.5 micrometers.
The researchers then used a computer-based image-fitting technique called GALFIT to model the individual clumps and the surrounding diffuse light. Each component was represented using a mathematical profile describing how its brightness changes with distance from its center.
The models allowed the researchers to estimate the apparent sizes and brightnesses of the individual regions.
However, the observed measurements still needed to be corrected for gravitational magnification.
The researchers constructed two independent models of the foreground cluster’s mass distribution. One used the Zitrin-Analytic method, while the other used the Glafic lens-modeling software.
Both models broadly agreed on the predicted locations and magnifications of the galaxy’s multiple images.
The Glafic model estimated magnifications of 28 ± 3 for ID1 and 21 ± 3 for ID2. The corresponding estimates from the Zitrin-Analytic model were approximately 31 and 35, respectively, although the latter has substantially larger uncertainty.
Using these models, the researchers reconstructed the galaxy in its original, or source-plane, appearance.
The result is a compact galaxy containing multiple stellar clumps rather than a single smooth concentration of light.
The two images are particularly valuable here. Their reconstructed morphologies and relative clump positions are highly similar despite their different lensing distortions, strengthening the case that the identified features represent genuine structures within the same galaxy.
Individual clumps contain roughly 10 million solar masses of stars
After correcting for magnification, the researchers estimated the physical properties of the galaxy and its individual clumps.
The total intrinsic ultraviolet magnitude is approximately −17.9 ± 0.2. This places the Misty Moons among relatively faint galaxies at these early cosmic epochs.
The estimated stellar masses of the two main images are also similar.
ID1 has an intrinsic stellar mass of approximately 3.7 × 10⁷ solar masses, while ID2 has approximately 3.4 × 10⁷ solar masses.
Their intrinsic half-light radii are approximately 181 ± 18 parsecs and 197 ± 28 parsecs, respectively. A half-light radius is the distance from a galaxy’s center that encloses half of its total measured light.
The individual clumps are substantially smaller.
Their estimated intrinsic effective radii range from approximately 15 to 67 parsecs in the measurements where the structures appear marginally resolved. Their stellar masses are generally around 10⁷ solar masses.
For ID1, the estimated clump masses are approximately:
- A.1: 1.1 × 10⁷ solar masses.
- B.1: 1.2 × 10⁷ solar masses.
- C.1: 7.4 × 10⁶ solar masses.
- D.1: 8.3 × 10⁶ solar masses.
For ID2, the corresponding estimates are:
- A.2: 1.0 × 10⁷ solar masses.
- B.2: 1.3 × 10⁷ solar masses.
- C.2: 9.5 × 10⁶ solar masses.
These measurements place the clumps in a similar general region of the size–mass relationship occupied by some compact stellar systems, including nuclear star clusters and young massive star clusters in nearby galaxies.
However, the smallest two clumps require particular caution.
Clumps A.1 and A.2 are so compact that their apparent sizes are only marginally larger than the telescope’s point-spread function, the characteristic blurring produced by its optical system.
When the researchers examined the higher-resolution F200W images separately, these two clumps were consistent with point sources.
This leaves two possible explanations. They may be slightly extended structures whose faint outer regions are difficult to detect, or they may be genuinely unresolved at the available resolution.
The researchers could not distinguish between these possibilities using the current observations.
If the clumps are unresolved, their intrinsic effective radii have upper limits of approximately 20 parsecs for A.1 and 26.4 parsecs for A.2. Their stellar surface densities would consequently be higher than the values estimated under the marginally resolved interpretation.
The study reports both possibilities rather than treating the apparent sizes as definitive measurements.
Some clumps have exceptionally high stellar densities
The estimated sizes and masses also allow the researchers to calculate how densely stars are packed within individual clumps.
Several have stellar mass surface densities approaching 10⁴ solar masses per square parsec.
This means that substantial amounts of stellar mass are concentrated within relatively small physical regions.
The two central clumps, A.1 and A.2, are especially compact. Under the marginally resolved interpretation, their stellar mass surface densities are approximately 10⁴ solar masses per square parsec.
If they are unresolved, their actual densities could be even higher.
The researchers also estimated the star formation rate surface density, which describes how much stellar mass is being formed within a given area over time.
Some of the clumps reach values of approximately 10² solar masses per year per square kiloparsec.
These measurements indicate that star formation is concentrated in compact regions rather than distributed uniformly across the galaxy.
The comparison with other stellar systems is also interesting.
The clumps occupy a similar region of the mass–size relationship to local nuclear star clusters, young massive star clusters, ultracompact dwarf galaxies and compact elliptical galaxies.
They also resemble individual star-forming clumps identified in other strongly lensed galaxies at high redshift.
Some of the observed high-redshift clumps are even smaller, with sizes below 10 parsecs, comparable to those of young star clusters and globular clusters.
The researchers discuss whether the Misty Moons clumps could represent early stages of globular cluster formation. Their estimated ages and masses are broadly compatible with that possibility, but the observations do not establish what these objects will eventually become.
Young stars dominate the galaxy’s light
The researchers investigated the stellar populations using the galaxy’s measured brightness across the different JWST filters.
They used Prospector to estimate the ages, stellar masses, dust content and star formation histories of the complete galaxy and its individual clumps.
They also applied a second fitting approach, Bagpipes, to the individual clumps using models with short star formation timescales.
The results indicate that the galaxy is dominated by young stellar populations.
Using flexible, nonparametric star formation histories, the estimated stellar ages of the complete systems are approximately 42–62 million years for ID1 and ID2.
The individual clumps generally have estimated ages of approximately 35–67 million years.
The Bagpipes models, which assume shorter star formation histories, produce younger estimates for several clumps, broadly in the range of approximately 15–50 million years.
The differences between the two approaches reflect their different assumptions about how star formation has changed over time. The researchers note that the age differences are not conclusive given the uncertainties.
The estimated dust extinction is also low.
For most of the clumps, the Prospector results indicate visual extinction values of approximately 0.01–0.14 magnitudes. The overall galaxy has similarly low estimated dust extinction, around 0.02 magnitudes.
The combination of young stellar populations and low dust content is consistent with a system experiencing strong early episodes of star formation.
The researchers suggest that the galaxy may be undergoing its first significant starbursts.
However, the available observations do not provide a complete record of its earlier star formation history, so this interpretation should not be treated as a confirmed description of its entire evolutionary history.
There is also an additional possibility involving the brightest central clumps.
Clumps A.1 and A.2 account for approximately half of the galaxy’s total observed brightness. Their compactness and luminosity mean that the researchers cannot completely exclude the possibility that they host active galactic nuclei, or AGNs.
An active galactic nucleus is a bright central region powered by material falling toward a supermassive black hole.
The current observations do not establish whether such objects are present. The researchers therefore retain this as an unresolved possibility rather than identifying the central clumps as confirmed stellar structures alone.
The clumps account for most of the galaxy’s stellar mass
One of the most important measurements in the study concerns the fraction of the galaxy’s stellar mass contained in its compact clumps.
The researchers calculated this by adding the estimated stellar masses of the individual clumps and comparing their combined mass with the total stellar mass of the galaxy.
Using the total isophotal measurements, which include both compact and diffuse light, they obtained 1σ lower limits of approximately 90% for ID1 and 78% for ID2.
In other words, the identified clumps could contain almost all the stellar mass inferred for the galaxy.
This is a striking result because the surrounding diffuse component contributes relatively little to the estimated total mass under this method.
However, the researchers recognize that measuring the total stellar mass is difficult when young stars dominate the observed light.
A population of older stars could contribute substantial mass while producing relatively little detectable light. This effect, known as stellar outshining, could cause the total stellar mass to be underestimated.
To investigate this uncertainty, the researchers also estimated the diffuse component separately using their GALFIT models.
With this alternative approach, the estimated clump mass fractions fall to approximately 54% for ID1 and 44% for ID2.
These values are lower than the estimates based on total isophotal fluxes, but the difference does not eliminate the central result. Even under the alternative measurements, the clumps contain a substantial fraction of the galaxy’s stellar mass.
The researchers adopt the total-isophotal estimates as their primary results because the stellar masses derived from the diffuse component have larger uncertainties owing to its low surface brightness.
The distinction is important. The study supports a highly clump-dominated stellar system, but the precise fraction depends on how the total stellar mass and diffuse light are estimated.
The galaxy is unusually clumpy even without its magnification
The strong gravitational lensing makes the Misty Moons appear much more structured than it would under ordinary observing conditions.
To investigate this effect, the researchers created a simulated observation of the reconstructed galaxy without lensing magnification.
They took the source-plane image of ID1 and convolved it with the point-spread function of JWST/NIRCam.
This effectively reproduced how the galaxy would appear if it were observed at its intrinsic brightness and size rather than through the magnifying effect of the foreground cluster.
The resulting image looks much smoother. Its individual clumps become blended together, producing an appearance comparable to that of other faint galaxies at redshifts greater than 10.
The researchers compared the simulated image with two distant galaxies, JADES-GS-z13-0 and JADES-GS-z14-1.
Both have observed morphologies similar to the simulated, unmagnified Misty Moons.
This comparison suggests that galaxies with internal clumps may appear relatively smooth when observed without sufficient spatial resolution.
The apparent absence of distinct structures in an ordinary image therefore does not necessarily mean that a galaxy lacks compact star-forming regions.
The researchers also quantified the clumpiness of the Misty Moons using a parameter called S.
This measurement compares the galaxy’s original light distribution with a smoothed version, providing an estimate of how much of its light is concentrated in smaller structures.
The researchers obtained a clumpiness value of 0.69, with a 1σ uncertainty of +0.17 and −0.16.
They compared this result with measurements of other observed galaxies and simulated systems.
The Misty Moons has a clumpiness value comparable to that of the Cosmic Grapes galaxy at a redshift of approximately 6.1.
Its clump luminosity function, which describes the distribution of clumps according to their star formation rates, is also systematically higher than those measured for lower-redshift lensed galaxies at redshifts of approximately 1–3 and the Cosmic Grapes.
The galaxy also shows higher clumpiness and clump luminosity measurements than the simulated galaxies examined in the study.
These comparisons suggest that its internal structure is particularly concentrated in compact star-forming regions.
However, the researchers emphasize that the interpretation depends on the available spatial resolution and the methods used to identify and measure the clumps.
Early galaxies appear to form stars differently from nearby dwarf galaxies
The high fraction of stellar mass contained in compact clumps becomes especially interesting when compared with nearby dwarf galaxies.
The researchers examined the clustered stellar mass fractions of galaxies across different cosmic epochs.
For the Misty Moons, the primary estimates are approximately 90% and 78% for its two images.
Other high-redshift galaxies and clumpy systems in the comparison sample also show relatively high fractions of stellar mass in clusters and clumps.
By contrast, nearby dwarf galaxies generally have much smaller fractions of their stellar mass in young clustered stellar systems.
The comparison indicates that high-redshift galaxies in the sample have clustered mass fractions of at least approximately 30%, while the corresponding values for local galaxies are generally 1% or less.
The difference is approximately two to three orders of magnitude.
This does not mean that all early galaxies necessarily follow the same pattern. Rather, the comparison suggests that strongly clumped star formation may be particularly common among at least some low-mass galaxies during the early universe.
The researchers also identify an important difference in star formation surface density.
High-redshift clumpy galaxies in their comparison exhibit star formation surface densities approximately 100–10,000 times greater than those of nearby dwarf galaxies with similarly low stellar masses, typically around 10⁷–10⁹ solar masses.
This difference provides a possible explanation for the unusually large stellar mass fractions concentrated in compact clumps.
In nearby galaxies, a relatively small fraction of newly formed stars may be gathered into massive clusters, while much of the galaxy’s stellar mass has accumulated over longer periods.
In some early low-mass galaxies, however, the clumps themselves appear to account for much of the total stellar mass.
The researchers suggest that the combination of high star formation surface densities and relatively short, intense episodes of star formation may help explain this difference.
They also note that high star formation surface density alone cannot explain every comparison. Some nearby blue compact dwarf galaxies have high star formation surface densities but relatively low clustered mass fractions.
This suggests that early clumpy galaxies may differ from local dwarf galaxies not only in the intensity of star formation but also in how quickly and how much of their stellar mass forms in compact regions.
Several possible processes could explain the clumpy structure
The observations establish that the Misty Moons contains multiple compact stellar clumps. They do not establish exactly how those structures formed.
The researchers discuss several possible mechanisms.
One possibility is violent disk instability.
In this scenario, a gas-rich galaxy develops a rotating disk that becomes gravitationally unstable. Dense regions of gas can then collapse and form massive clumps.
The high star formation surface densities and large clustered mass fractions observed in the Misty Moons are consistent with this general picture.
Some studies discussed by the authors suggest that rotating gas disks may already have existed at redshifts greater than 10, although the current observations cannot confirm that such a disk exists in the Misty Moons.
Another possibility is fragmentation of dense gas filaments.
In this scenario, streams of gas flowing into a young galaxy break into smaller dense regions before reaching its center. These regions can then form stars and compact stellar systems.
The researchers discuss cosmological radiation-hydrodynamic simulations in which low-mass galaxies at redshifts greater than 8 form star clusters through the fragmentation of dense accreting filaments.
They also consider turbulence-driven fragmentation, in which turbulent gas motions contribute to the formation of dense star-forming regions.
A further possibility is that the clumps formed through a galaxy merger.
When galaxies interact and merge, their gas and stars can become concentrated into multiple regions, potentially producing a clumpy appearance.
The researchers discuss the possibility that the Misty Moons has undergone such an event because its central clumps appear relatively younger than some of the other clumps in the stellar population estimates.
However, the differences in estimated stellar ages are not sufficiently conclusive to establish that the clumps have different formation histories.
The paper also discusses the possibility that weak stellar feedback could contribute to the survival of numerous compact star-forming regions.
Feedback refers to the effects that newly formed stars have on their surrounding gas, including the energy and radiation they release. These processes can influence how much gas remains available for further star formation.
A weak-feedback scenario has previously been considered for the Cosmic Grapes galaxy, which also exhibits substantial clumpiness.
The authors suggest that a similar explanation may be applicable to the Misty Moons, although the available data do not establish the strength of feedback in this galaxy.
These different possibilities are not necessarily mutually exclusive. The present observations do not allow the researchers to determine which mechanism, or combination of mechanisms, produced the observed structures.
Important questions remain about the smallest clumps and their origins
Several limitations prevent a complete physical interpretation of the Misty Moons.
The first concerns the sizes of the most compact clumps.
Although the combined detection images suggest that A.1 and A.2 are slightly extended, the higher-resolution F200W observations are consistent with point sources. The researchers therefore cannot establish whether these structures are genuinely resolved or smaller than the telescope can distinguish.
The second concerns the stellar populations.
The available NIRCam observations provide little coverage at wavelengths longer than the Balmer break. This makes it difficult to measure the ages and star formation histories of individual clumps precisely, particularly when older stellar populations may contribute substantial mass without dominating the observed light.
The possibility of active galactic nuclei in the central clumps also remains unresolved.
Finally, the redshift is photometric rather than spectroscopic. Although the observations strongly favor a redshift greater than 10, the exact value remains uncertain because the fitting results depend on whether Lyα emission is included.
The researchers identify future observations with JWST’s NIRSpec integral-field unit and Mid-Infrared Instrument as particularly useful.
NIRSpec/IFU observations could provide information about gas motions and the spatial distribution of stellar and gaseous properties. MIRI observations could help measure metallicity and detect optical continuum emission from older stellar populations.
These measurements would help distinguish between the possible formation scenarios and provide a clearer picture of the physical properties of the individual clumps.
For now, the Misty Moons remains a galaxy whose internal structure is visible in unusual detail because of gravitational magnification, but whose smallest components and formation history cannot yet be fully established.
The study was published in The Astrophysical Journal.