Some of the brain’s long-range white matter pathways connect regions that sit close together in the brain’s organizational hierarchy, while others stretch across that hierarchy, linking sensorimotor areas with higher-order association regions. Those hierarchy-spanning tracts are also the ones associated with a wider range of cognitive functions, stronger developmental changes during childhood and adolescence, and larger individual differences in cognition.
Long-range white matter tracts provide pathways for communication between distant parts of the brain. But the researchers wanted to know whether these anatomical pathways are arranged in a systematic relationship to the broader organization of the cortex, and whether that arrangement is related to the kinds of cognitive functions the tracts support.
The study focused on a major organizational gradient of the cerebral cortex known as the sensorimotor-to-association, or S–A, axis. Along this axis, cortical regions vary from areas involved in relatively basic sensory and motor processing to regions involved in higher-order association processes.
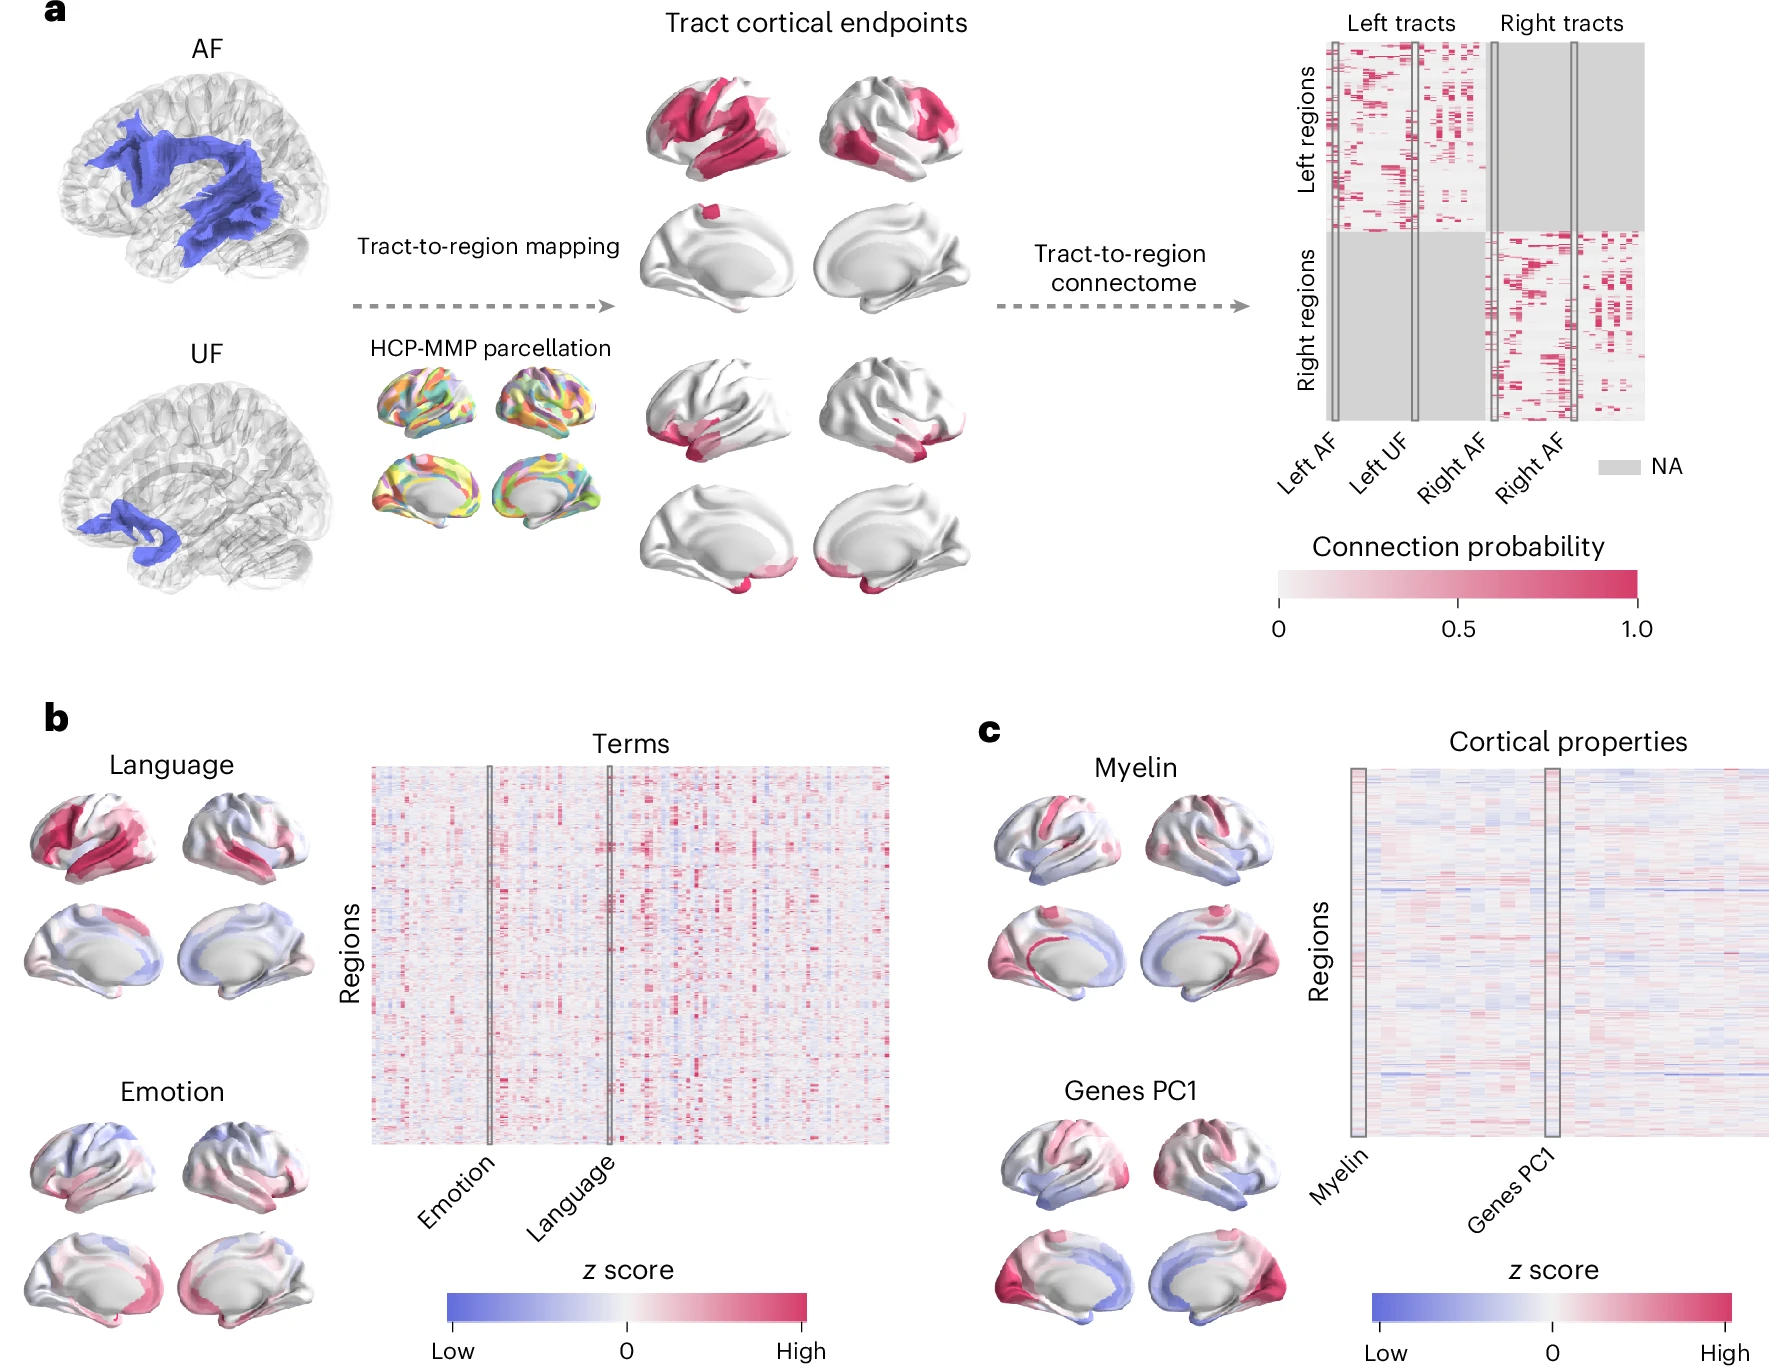
The researchers assembled several large-scale brain maps to place anatomical white matter tracts within that organization. The foundation was a population-level tract-to-region connectome built from diffusion MRI data from 1,065 young adults in the Human Connectome Project Young Adult dataset. It mapped 52 major white matter tracts, 26 in each hemisphere, onto 360 cortical regions in the HCP multimodal parcellation. A connection was treated as present when at least half of the population showed the corresponding tract-to-region connection.
This approach differs from a conventional structural connectome, which generally represents the brain as connections between pairs of regions without identifying which anatomical tract carries the connection. Here, a single tract could be represented as a system connecting multiple cortical regions.
The researchers then added two other kinds of information. One was a set of 125 cognitive terms derived from the Cognitive Atlas and mapped through Neurosynth, a database that combines results from more than 15,000 published fMRI studies. These maps provided measures of how strongly different cortical regions were associated with cognitive terms ranging from motor processes to language, memory, emotion, attention and executive functions.
The other was a set of 28 biological features describing the cortical regions connected by the tracts. These included measures related to intracortical myelination, gene expression, cortical layer thickness, synapse density and neurotransmitter receptors and transporters.
Together, the datasets allowed the researchers to ask whether the anatomical position of a tract within the cortical hierarchy was related to its spatial reach, cognitive profile and the biological characteristics of the regions it connects.
Longer tracts reach farther across the cortical hierarchy
The first analysis compared the physical distance between cortical regions connected by each tract with the tract’s position along the S–A axis.
The researchers calculated the average three-dimensional distance between connected regions and also calculated each tract’s S–A range. The latter was the difference between the highest and lowest S–A ranks among the regions connected by a tract. A larger range therefore indicated that a tract reached across a broader portion of the cortical hierarchy.
The two measures were strongly associated. Across the 52 tracts, the Spearman correlation was 0.688, with a permutation-test P value below 0.001 after 10,000 iterations. The relationship remained when the researchers used geodesic distance, which measures the shortest route along the cortical surface rather than a straight-line distance through the brain.
The pattern was also present when the researchers separated the tracts into projection and association categories. The correlation between spatial distance and S–A range was 0.683 for projection tracts and 0.557 for association tracts, with permutation-test P values of 0.001 for both.
These results established a basic spatial pattern: some tracts mainly connect regions occupying similar levels of the cortical hierarchy, while others reach between more widely separated levels.
Different tracts are associated with different cognitive functions
The next question was whether that anatomical organization corresponded to cognition.
The researchers used partial least squares analysis to examine the relationship between the 125 cognitive maps and the 26 bilateral tract maps. The analysis identified one significant latent pattern that accounted for 47.2% of the covariance between the two datasets. A spatial permutation test based on 10,000 iterations gave a P value of 0.002.
The pattern also held up in a distance-dependent cross-validation designed to avoid overstating the result because neighboring cortical regions tend to resemble one another. The median correlation between predicted cognitive-term scores and tract scores in the out-of-sample regions was 0.65. It exceeded the spatially constrained null distribution with P = 0.011 based on 1,000 spin permutations.
The analysis separated tracts associated with different kinds of cognitive functions. The uncinate fasciculus, the paraolfactory segment of the cingulum and the anterior corticostriatal tract were associated with terms such as mood, risk and emotion. Other tracts, including the superior longitudinal fasciculus, middle longitudinal fasciculus and posterior corticothalamic tract, were more closely associated with movement, imagery and action.
The researchers then examined each tract individually. They averaged the cognitive associations of the cortical regions connected to each tract across 125 cognitive terms and grouped those terms into 11 broader categories.
The resulting profiles showed that tracts could have very different combinations of cognitive associations. The left arcuate fasciculus had a predominant association with language but also showed involvement across the other categories. The right arcuate fasciculus did not show the same language enrichment and instead had broader involvement across categories. The corticospinal tract was strongly associated with motor control and movement but also showed associations with imagery and coordination. The uncinate fasciculus had a predominance of emotion-related functions, while the vertical occipital fasciculus was associated particularly with attention and perception.
The results therefore did not place every tract into a single cognitive box. Instead, they revealed a continuum between more specialized and more broadly distributed cognitive profiles.
The widest-reaching tracts have the broadest cognitive profiles
To quantify that continuum, the researchers used a statistical measure called the Gini coefficient. In this analysis, a high Gini coefficient meant that a tract’s associations were concentrated in a relatively small number of cognitive terms, while a low value meant that its associations were distributed more evenly across the 125 terms.
Among the most specialized tracts were the optic radiation, fornix and corticobulbar tract. Among the most cognitively diverse were the inferior fronto-occipital fasciculus, middle longitudinal fasciculus and inferior longitudinal fasciculus.
The relationship with cortical hierarchy was pronounced. Across the 52 tracts, S–A range and Gini coefficient had a Spearman correlation of −0.700, with a permutation-test P value below 0.001.
Because lower Gini values represented greater cognitive diversity, the negative correlation meant that tracts spanning more of the cortical hierarchy tended to have broader cognitive profiles. Conversely, tracts whose cortical endpoints occupied more similar levels of the hierarchy tended to have more specialized profiles. The relationship was also present when projection and association tracts were analyzed separately.
A tract-rewiring analysis provided another test of the pattern. The researchers preserved the number of cortical connections assigned to each tract but randomly changed which regions were connected, keeping connections within the appropriate hemisphere. The relationship between hierarchical span and cognitive diversity remained under this alternative null model.
The endpoints of broad-reaching tracts are biologically different too
The researchers next examined whether the cortical regions connected by different tracts also differed in their biological characteristics.
They compared the 28 cortical biological features for every pair of the 360 cortical regions and calculated how similar the biological profiles of connected regions were for each tract.
The vertical occipital fasciculus, for example, connected regions with relatively homogeneous biological profiles. Its mean cortical similarity was 0.68 in the example shown. The inferior fronto-occipital fasciculus connected regions with much more heterogeneous profiles, with a mean similarity of 0.07 in the corresponding example.
Across the tracts, broader hierarchical span was associated with lower biological similarity. The correlation between S–A range and mean cortical similarity was −0.649, with P < 0.001 in a 10,000-iteration permutation test.
Cognitive diversity showed the complementary relationship. Tracts with lower Gini coefficients, meaning more evenly distributed cognitive associations, tended to connect cortical regions with less similar biological profiles. The correlation between Gini coefficient and mean cortical similarity was 0.599, also with P < 0.001.
The pattern survived separate analyses of projection and association tracts and a tract-rewiring analysis. The researchers also compared S–A range with an alternative measure based on the average S–A position of a tract’s endpoints. Across the analyses, S–A range was more consistently related to tract distance, cognitive diversity and biological similarity, supporting its use as a measure of how broadly a tract spans the cortical hierarchy.
Taken together, these population-level results connected three features of white matter organization: hierarchical span, cognitive diversity and biological heterogeneity of cortical endpoints.
The pattern appears during brain development
The researchers then moved from population-level maps to individual differences in children and young adults.
They first analyzed diffusion MRI data from 1,145 participants in the Philadelphia Neurodevelopmental Cohort, ranging from 8 to 23 years old. For 32 tracts available in the developmental analysis, they measured fractional anisotropy, or FA, a diffusion-MRI measure describing how strongly water diffusion is directionally constrained within white matter.
They used generalized additive models to relate tract FA to age while adjusting for sex and in-scanner head motion. Of the 32 tracts, 30 showed significant age-related changes after false-discovery-rate correction. Their partial R² effect sizes ranged from −0.009 to 0.321, and all but one of the significant tracts showed positive associations between FA and age.
The magnitude of these developmental associations was related to where the tracts sat in the cortical hierarchy. Tracts with larger S–A ranges had stronger age-related effects, with a correlation of 0.708 and an FDR-corrected permutation P value below 0.001.
The same developmental effect was stronger in more cognitively diverse tracts. The correlation between age-effect size and Gini coefficient was −0.445, with an FDR-corrected P value of 0.016.
The researchers tested the developmental pattern independently in the Healthy Brain Network, which included 638 participants aged 5 to 22 years. The relationship between S–A range and age-related FA effects was again positive, with rs = 0.666 and an FDR-corrected permutation P value below 0.001. The relationship between cognitive diversity and age effects was again negative, with rs = −0.375 and P = 0.03.
The researchers also examined other diffusion measures. Mean diffusivity did not show a consistent relationship with either S–A range or cognitive diversity in either developmental dataset. In the HBN, however, intracellular volume fraction, derived from multishell diffusion imaging, reproduced the overall pattern: its age-related effects were positively related to S–A range and negatively related to Gini coefficient.
For intracellular volume fraction, the correlations were 0.398 with S–A range and −0.640 with Gini coefficient, with FDR-corrected permutation P values of 0.02 and below 0.001, respectively.
The authors therefore interpreted the FA and intracellular-volume-fraction results as evidence that the relationship between developmental variation and tract organization was not restricted to a single diffusion measure. The results were associations with age, however, rather than a longitudinal demonstration that individual tracts changed in response to their position in the cortical hierarchy.
The same organization is related to individual differences in cognition
The final analyses asked whether the same tract characteristics were related to cognitive performance between individuals.
In the Philadelphia Neurodevelopmental Cohort, the researchers focused on executive efficiency, a composite measure capturing the balance between speed and accuracy on tasks involving executive function, including attention and working memory.
Mean FA was significantly associated with executive efficiency in 22 of the 32 tracts after FDR correction. The significant partial R² values ranged from 0.004 to 0.023, and all of the significant associations were positive, meaning higher FA was associated with higher executive-efficiency scores in those tracts.
Again, the strength of the association depended on the tract’s position in the cortical hierarchy. Cognition-related effect sizes were positively associated with S–A range, with rs = 0.495 and an FDR-corrected permutation P value of 0.006. They were negatively associated with Gini coefficient, with rs = −0.377 and P = 0.037.
The researchers then tested the relationship in an independent sample of 1,097 adults aged 22 to 37 years from the Human Connectome Project Young Adult dataset. Here cognition was measured using the NIH Toolbox fluid cognition composite.
The results followed the same pattern. FA-cognition effect sizes were positively related to S–A range, with rs = 0.587 and P = 0.001 after FDR correction. They were negatively related to Gini coefficient, with rs = −0.601 and P = 0.001.
Mean diffusivity again failed to show a consistent relationship with either hierarchical span or cognitive diversity. In the PNC, the correlation between MD-cognition effects and S–A range was −0.08, with an FDR-corrected P value of 0.8. In HCP-YA, it was −0.329, with P = 0.1. The corresponding relationships with Gini coefficient were also not consistently significant.
Thus, across the two datasets, the clearest individual-level pattern involved FA: the tracts that crossed broader portions of the cortical hierarchy and were associated with more diverse cognitive functions also showed stronger relationships between tract FA and cognitive performance.
What the measurements can and cannot establish
The researchers interpret the combined results as evidence for a cortex-anchored way of describing white matter organization. Rather than treating association and projection tracts as broad anatomical categories, the study places individual tracts according to the cortical hierarchy they span and the properties of their endpoints.
The developmental results also led the authors to propose a possible explanation for why hierarchy-spanning tracts showed stronger age-related changes. They point to the extensive refinement of association cortex during adolescence and suggest that activity-related developmental changes in those cortical regions could contribute to greater remodeling in connected white matter. The authors explicitly describe this as speculation and note that animal studies would be needed to clarify the mechanisms.
They also discuss the possibility that long-range tracts connecting primary sensorimotor and higher-order association territories may need to integrate information between regions that mature at different times. This interpretation is consistent with the observed associations, but the study itself did not experimentally establish such a developmental mechanism.
Several limitations constrain how the findings should be interpreted.
The tract-to-region maps came from publicly available data, so the study was constrained by the tractography methods and tract types represented in those resources. The population-level maps also do not capture all individual variation in tract-to-cortex connections, even though most connection probabilities were close to either zero or one.
Only 32 of the 52 tracts in the population atlas could be used for the individual-level development and cognition analyses because of changes in the DSI Studio white matter atlas over time. The tractography itself remains an approximation and cannot fully capture the complex fiber dispersion and branching observed in anatomical tracer studies.
Finally, FA is not a direct measure of a single biological property of white matter. It reflects the degree to which water diffusion is directionally constrained and can be influenced by factors including crossing fibers, fiber diameter and density, and myelination.
The study also leaves several questions open. The authors note that the analysis did not include commissural and subcortical tracts and that the hierarchical organization and cognitive roles of short U-fibers remain to be characterized. They call for longitudinal developmental studies to examine how cortical function and white matter development relate over time, as well as age-specific tract-to-region maps to determine whether tract-cortex connections themselves change across the lifespan.
For now, the results describe a consistent association: white matter pathways that reach across a larger portion of the sensorimotor-to-association cortical hierarchy tend to connect more biologically dissimilar cortical regions, have broader cognitive profiles, undergo stronger age-related changes in several diffusion measures, and show stronger relationships with individual differences in cognitive performance.
The study was published in Nature Human Behaviour.