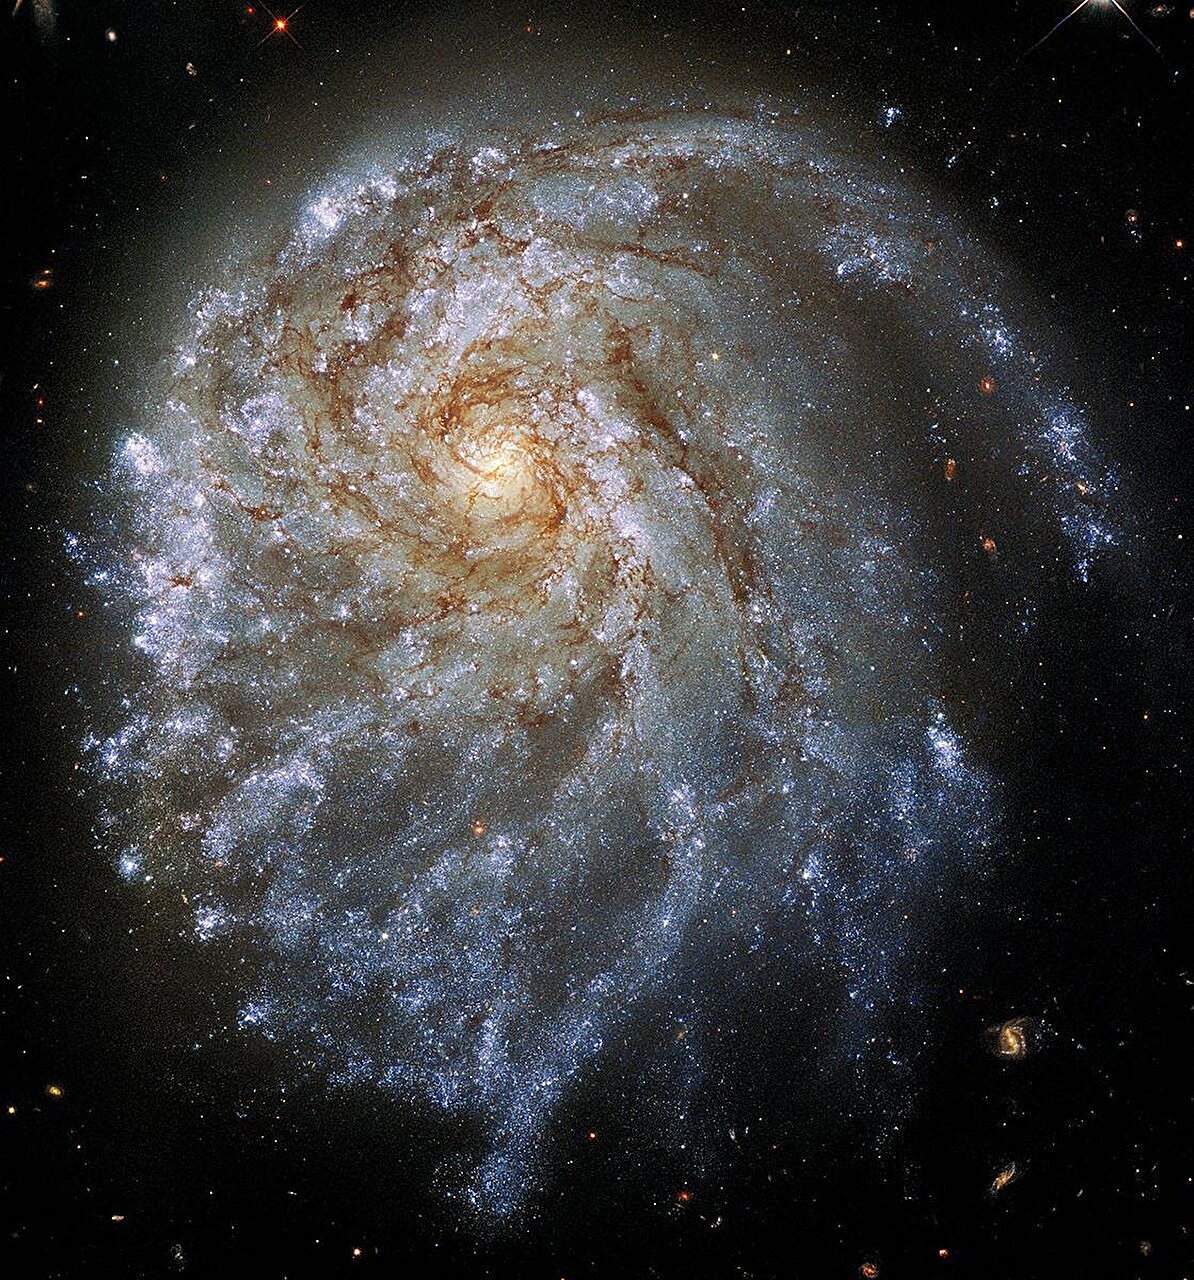
Some galaxies have disks that are visibly out of balance. Their outer regions extend farther on one side than the other, giving the galaxy an uneven appearance even when its overall structure resembles a familiar spiral. A statistical analysis of 606 disk galaxies has identified a striking pattern in this asymmetry: it tends to be strongest in smaller, slower-rotating systems and weaker in more massive, faster-rotating ones. A large cosmological simulation reproduces much the same relationship, adding evidence that a galaxy’s internal dynamics may help regulate how lopsided its disk becomes.
Astronomers use the term lopsidedness to describe a one-sided asymmetry in a galaxy’s disk. The disk’s photometric or kinematic center can be displaced from its geometric center, while its outer contours may look different on opposite sides. The imbalance can be measured in the distribution of stars or gas.
To quantify it, astronomers use a mathematical method called Fourier analysis. The method separates a galaxy’s structure into patterns arranged around its center. Each pattern is described by a number, or mode, that captures a different kind of asymmetry.
The first mode, called m = 1, measures the one-sided pattern associated with lopsidedness. Its strength is represented by A₁. A larger A₁ means a more pronounced asymmetry. The second mode, m = 2, measures a two-sided pattern commonly associated with bars and two-armed spiral structure. Its amplitude is called A₂.
These measurements describe the strength of a pattern, not what produced it. A lopsided disk might reflect gravitational disturbances from another galaxy, uneven gas accretion, an offset between the disk and its dark matter halo, or an instability arising within the disk itself. Several of these processes could also operate together.
The origin of lopsidedness remains debated. The researchers, led by A. U. Omonov of the National University of Uzbekistan, set out to examine how the measured patterns vary across a much larger collection of galaxies than had been available for some earlier statistical comparisons. They focused on the overall distribution of A₁ and A₂, the relationship between the two modes, and how lopsidedness changes with galaxy type, rotation speed and stellar mass.
A larger collection of galaxies
The team began with a catalog of 683 entries assembled from 37 published studies. Because some galaxies appeared more than once under different names or catalog identifiers, the researchers standardized the identifiers and removed duplicates. When a galaxy had measurements from more than one source, they retained the most recent measurement.
The resulting compilation contained 606 unique galaxies. Of these, 442 had usable A₁ measurements, and 302 also had A₂ measurements. No galaxy in the final sample had an A₂ measurement without an accompanying A₁ value.
The galaxies covered a broad range of morphologies, from elliptical and lenticular systems with detectable disks to late-type spirals and irregular galaxies. Their absolute B-band magnitudes ranged from −22.8 to −15.7, and their redshifts extended from approximately zero to 0.06.
The researchers also examined available measurements of gas rotation speed, central stellar velocity dispersion and distance. For a separate analysis of galaxy mass, they matched 246 objects to independent stellar-mass estimates from the literature.
The compilation is large, but it is not a uniform survey conducted with one instrument and one measurement procedure. Its 37 source studies used different observing methods, normalizations and radial apertures. Most measured the Fourier amplitudes between 1.5 and 2.5 effective radii, while some integrated over the full detected disk. These differences can add scatter and complicate direct comparisons between galaxies.
That qualification is important throughout the analysis. The researchers were looking for relationships that persist across a heterogeneous collection, not claiming that every galaxy had been measured under identical conditions.
Most galaxies have modest asymmetries
The first result concerned the distribution of the two Fourier amplitudes across the sample.
For A₁, the average amplitude was 0.157 and the median was 0.117. For A₂, the average was 0.153 and the median was 0.114. In both cases, the difference between the mean and median reflected a distribution weighted toward relatively small amplitudes, with a smaller number of galaxies displaying much stronger patterns.
Most measurements clustered around amplitudes of 0.05 to 0.10. The distributions also had extended tails reaching roughly 0.5 to 0.8, with a handful of formally measured values above 1.
To describe the shape of these distributions, the researchers compared three statistical models. A Rayleigh distribution can describe an amplitude produced by combining many independent contributions with random phases. An exponential distribution can describe a quantity that declines over a characteristic timescale. A log-normal distribution can arise when a quantity develops through repeated multiplicative changes, such as the amplification of an initially small disturbance.
The log-normal model provided a substantially better fit for both A₁ and A₂.
For A₁, its Kolmogorov-Smirnov distance from the observed distribution was 0.046. The corresponding values were 0.242 for the Rayleigh model and 0.109 for the exponential model. For A₂, the distances were 0.048, 0.273 and 0.091, respectively. Smaller distances indicate a closer fit.
The researchers also compared the models using the Akaike and Bayesian information criteria, which account for model fit while penalizing unnecessary complexity. Those comparisons likewise favored the log-normal form. Its advantage in the Akaike information criterion exceeded 200 relative to the Rayleigh model and was about 35 to 60 relative to the exponential model.
The best-fitting log-normal distributions had natural-log means of −2.20 for A₁ and −2.27 for A₂, with dispersions of 0.87 and 0.92. These parameters correspond to characteristic median amplitudes of about 0.11 and 0.10, respectively.
The result suggests that the two kinds of asymmetry share a similar statistical pattern across the galaxy population. The authors interpret the log-normal distributions as evidence consistent with multiplicative amplification: a small initial disturbance could grow through an instability in a galaxy’s disk.
That is a possible physical interpretation, not a mechanism established by the distribution alone. The researchers used the Kolmogorov-Smirnov distances to rank the candidate models, rather than treating them as formal hypothesis tests, because the model parameters were estimated from the same data used in the fit. Their additional statistical comparisons also favored the log-normal model, but no statistical distribution uniquely identifies the process that produced it.
The two patterns tend to rise together
The researchers next examined whether galaxies with stronger one-sided asymmetries also tend to have stronger two-sided structures.
Among the 302 galaxies with both measurements, A₁ and A₂ were positively correlated. The Pearson correlation coefficient was 0.274, while the Spearman rank correlation was 0.501, with a probability value below 10⁻¹⁹.
The two coefficients describe related but different aspects of the relationship. Pearson correlation measures how closely two quantities follow a linear relationship. Spearman correlation measures whether they generally increase together, even when the relationship is not tightly linear. The stronger Spearman result indicates a clear overall tendency for A₂ to rise as A₁ rises, despite substantial scatter among individual galaxies.
A linear fit gave a slope of approximately 0.29 and a positive intercept of 0.11. In practical terms, A₂ tended to increase with A₁, but it did not approach zero when A₁ became very small.
That intercept points to an important distinction. A galaxy can have a two-sided pattern even without a strong lopsided component. Bars and spiral arms can contribute to A₂ independently of A₁. The authors interpret the observed relationship as a combination of this underlying contribution and an additional component that increases with lopsidedness.
They discuss two possible ways the modes could be connected. The presence of a strong m = 1 disturbance might generate additional higher-order structure through nonlinear interactions within the disk. Alternatively, the geometry of an intrinsically lopsided galaxy could contribute to the measured higher-order Fourier components. The statistical relationship does not establish which explanation is responsible.
The relative strengths of the modes were also broadly similar. For 291 galaxies with A₁ above 0.02, a threshold used because the ratio becomes numerically unstable at smaller values, the median A₂/A₁ ratio was 0.90. About 44.7 percent had A₂ greater than A₁, while 55 percent had A₁ greater than A₂.
Neither mode therefore dominated across the population as a whole. The ratio showed a mild morphological trend, with earlier-type galaxies tending to have somewhat larger A₂/A₁ values than later-type systems.
Similar amplitudes should not be mistaken for equal energy in the two modes. The kinetic energy associated with a Fourier pattern depends not only on its amplitude but also on its pattern speed. The measured ratio cannot establish energy equipartition.
Later-type galaxies have stronger lopsidedness
One of the clearest relationships appeared when the researchers compared A₁ with galaxy morphology.
Astronomers often describe galaxy types using a numerical scale called de Vaucouleurs T-type. Lower values represent earlier types, including elliptical and lenticular systems. Higher values represent progressively later spiral types, extending toward irregular and Magellanic-type galaxies.
The median A₁ rose across this sequence. It was approximately 0.07 in the E/S0 group and reached about 0.37 in the Sm/Im group, an increase of roughly five times.
The Kendall rank correlation was 0.234, with a probability value of approximately 10⁻¹². This indicates a strong statistical relationship between later morphological type and higher lopsidedness amplitudes.
The m = 2 pattern behaved differently. A₂ showed no statistically significant trend with morphology. Its Kendall correlation was only 0.044, with a probability value of 0.26. Median A₂ values remained broadly between 0.09 and 0.20 across the morphological groups.
The contrast suggests that the two kinds of structure do not vary in the same way as galaxies change from earlier to later types. The authors suggest that the m = 1 pattern may be easier to excite and sustain in dynamically colder disks. In this context, a dynamically colder disk is one in which the motions of stars are less dominated by random velocities relative to the overall rotation.
The comparatively steady A₂ measurements may reflect contributions from bars and spiral arms across much of the disk-galaxy population. These are interpretations of the observed trends, however, not mechanisms directly tested by the morphological comparison.
Faster rotation goes with weaker asymmetry
The strongest relationship with a measured physical property emerged between A₁ and the rotation speed of a galaxy’s gas.
Across the 387 galaxies with available rotation measurements, the Spearman correlation was −0.432, with a probability value of 5.1 × 10⁻¹⁹. The negative relationship means that faster-rotating galaxies generally had lower lopsidedness amplitudes.
The difference was also visible in the median values. Galaxies with gas rotation speeds above approximately 150 kilometers per second had a median A₁ of about 0.06. Those rotating below approximately 60 kilometers per second had a median of about 0.19.
The researchers also compared lopsidedness with absolute B-band magnitude. The relationship was weaker, with a Pearson coefficient of +0.212. Because brighter galaxies have more negative absolute magnitudes, the positive coefficient means that more luminous galaxies tended to have lower A₁. This is consistent with the rotation-speed trend, since more luminous galaxies are generally more massive.
Central stellar velocity dispersion did not show a comparably strong relationship. Its Pearson correlation with A₁ was −0.054, and its Spearman correlation was −0.158. The latter had a probability value of 0.046, which did not meet the study’s adopted significance threshold of 0.01.
Nor did A₁ show a significant relationship with redshift in this sample. The galaxies extended only to redshift 0.06, so this result applies to the relatively nearby population examined. It suggests that there was no obvious distance-related trend in the measured amplitudes over that range, but it does not establish that the compilation is free of selection effects.
The researchers checked whether a few extreme measurements were responsible for the rotation-speed relationship. Some galaxies had formally measured A₁ or A₂ values above 1, which can occur when source studies use different normalizations or when measurement uncertainties are amplified by features such as an off-center bar or interaction. Excluding these extreme objects left the median A₁ nearly unchanged, at 0.118. The Spearman correlation with rotation speed changed only slightly, from −0.427 to −0.432.
The main relationship was therefore not driven by those unusual measurements.
Stellar mass helps explain the rotation trend
Rotation speed provides a way to investigate the gravitational potential of a galaxy, but the researchers wanted to test the relationship with stellar mass more directly.
The main compilation included absolute B-band magnitudes, but not consistent stellar-mass measurements for every galaxy. Brightness is an imperfect substitute for mass because galaxies can produce different amounts of light for the same amount of stellar material.
To make a more direct comparison, the researchers matched their Fourier measurements with independent stellar-mass estimates from the literature. This produced a subsample of 246 galaxies, spanning log stellar masses from 8.28 to 11.30 when mass is expressed in solar units. The median was 10.23.
The relationship with lopsidedness was clear. The Pearson correlation between A₁ and stellar mass was −0.383, and the Spearman correlation was −0.395, with a probability value of 1.3 × 10⁻¹⁰ for the latter.
As stellar mass increased, median lopsidedness generally declined. Around a stellar mass of 2 billion solar masses, corresponding to a log mass of about 9.3, median A₁ was approximately 0.29. At around 56 billion solar masses, or a log mass of about 10.75, it was approximately 0.07. That is a roughly fourfold reduction across about 1.5 orders of magnitude in stellar mass.
The mass-binned measurements show how the decline develops across the better-populated part of the sample:
| Log stellar mass (solar masses) | Number of galaxies | Median A₁ |
|---|---|---|
| 8.75 | 4 | 0.320 |
| 9.25 | 22 | 0.294 |
| 9.75 | 59 | 0.186 |
| 10.25 | 88 | 0.114 |
| 10.75 | 65 | 0.074 |
| 11.25 | 7 | 0.150 |
The lowest- and highest-mass bins contain very few galaxies, so their median values are not individually informative. The main decline is visible across the more populated middle of the mass range.
But stellar mass and rotation speed are related properties. In the 246-galaxy subsample, their Pearson correlation was 0.64. Both also varied with morphological type. That makes it difficult to tell from separate, one-variable comparisons which property is most closely associated with lopsidedness.
To separate their contributions, the researchers performed a multivariable regression analysis incorporating stellar mass, morphological T-type and gas rotation speed. The model explained about 23 percent of the variation in the logarithm of A₁.
Rotation speed retained the strongest independent relationship with lopsidedness. Its standardized regression coefficient was −0.282, with a probability value of 1.5 × 10⁻⁴. Morphological type also retained an independent positive contribution, with a standardized coefficient of 0.199 and a probability value of 1.7 × 10⁻³.
Stellar mass, however, was no longer statistically significant after accounting for rotation speed and morphology. Its probability value was 0.13.
This changes how the mass relationship should be interpreted. More massive galaxies are less lopsided when considered on their own, but much of that association overlaps with the relationship between rotation speed and A₁. The authors argue that the depth of a galaxy’s gravitational potential, traced by its rotation speed, may be more directly connected to lopsidedness than stellar mass itself.
The analysis does not show that faster rotation causes a disk to become more symmetrical. It identifies which of several interconnected galaxy properties retains the strongest statistical relationship when the others are considered at the same time.
A cosmological simulation shows a similar decline
The researchers also compared the observed mass relationship with galaxies in IllustrisTNG50-1, a large cosmological computer simulation.
They used a catalog of 915 simulated disk galaxies at the present-day snapshot, analyzed with the TNGGalaxyLab Fourier-decomposition pipeline. The selection included central galaxies rather than satellites, required at least 10,000 stellar particles for reliable measurements, and selected systems with a disk-to-total stellar mass ratio greater than 0.4. These criteria were intended to identify galaxies whose stellar structures were genuinely disk-dominated.
For a direct comparison, the researchers restricted the simulated sample to the same stellar-mass interval covered by the 246 observed galaxies. This left 888 simulated galaxies. The two samples were restricted to a common mass range, but their mass distributions within that range were not deliberately matched.
The central relationship appeared in both populations. In the observations, the Spearman correlation between A₁ and stellar mass was −0.395. In the simulation, it was −0.445. Within the statistical uncertainty, the two coefficients were very similar.
Median lopsidedness also declined with increasing mass in both samples. Around log stellar mass 9.5, the observed median A₁ was about 0.24, compared with approximately 0.12 in the simulation. By log mass 10.75, the medians were about 0.07 and 0.06, respectively.
The simulation therefore reproduced the direction and approximate strength of the mass relationship. But it did not reproduce the overall level of lopsidedness in the observational compilation. At a given mass, observed median amplitudes were roughly 1.4 times higher than simulated ones. The ratio of the overall medians was 1.44.
A two-sample Kolmogorov-Smirnov comparison also indicated that the observed and simulated A₁ distributions differed, with D = 0.292 and a probability value of approximately 3.8 × 10⁻¹⁵.
The authors discuss several possible reasons for the difference. The observational sample combines 37 studies spanning four decades, with varying measurement procedures and target-selection criteria. Some source studies preferentially selected galaxies already known to be lopsided, which could raise the measured amplitudes relative to a more uniformly selected population.
The radial regions used for the measurements also differ. Most observational sources measured A₁ between 1.5 and 2.5 effective radii, while the simulation pipeline used a range between 1.5 and 2.5 disk scale lengths. For an exponential disk, the effective radius is about 1.678 times the disk scale length, so the observational aperture reaches roughly 30 percent farther out than the simulated one. Because A₁ increases with radius over the relevant range, this mismatch could contribute an estimated 10 to 20 percent to the higher observed amplitudes.
The authors also note that an earlier comparison using a single, more uniform observational survey produced much closer agreement with TNG50. That result supports the possibility that differences in sample selection and measurement procedures contribute substantially to the offset.
The comparison is therefore strongest as evidence for the shared mass trend, not as proof that the simulation and observations have identical lopsidedness amplitudes. The simulation reproduces the decline with mass while generally producing weaker asymmetries.
What might regulate a galaxy’s lopsidedness?
The relationships with rotation speed and stellar mass raise a question about the physical conditions that allow an asymmetric pattern to develop and persist.
One possibility is that lopsided disturbances are easier to excite in low-mass galaxies, whose gravitational potentials are shallower. Another is that low-mass disks retain the imprint of earlier disturbances for longer. The authors discuss differences in dynamical friction and rotational shear as possible contributors to how long such patterns survive.
The log-normal amplitude distributions are consistent with the idea that an initial disturbance can be amplified, while the mass and rotation trends suggest that the amplification or persistence of the resulting pattern may depend on a galaxy’s internal dynamics. These observations do not establish that the same process operates in every galaxy, or distinguish whether the main difference lies in how easily disturbances arise or how long they last.
External influences remain possible, too. Gravitational encounters, minor mergers and uneven gas accretion may all contribute to lopsidedness in individual systems. The authors argue that a purely tidal explanation is not sufficient to account naturally for the population-wide trend: the more massive, faster-rotating galaxies in the sample are generally less lopsided, rather than more.
But the compilation does not include the environmental measurements needed to test the role of neighboring galaxies directly. The researchers therefore do not rule out tidal or accretion-driven contributions. A galaxy’s surroundings may matter even if its internal properties help determine how strongly an asymmetry develops or how long it remains visible.
Distinguishing between the proposed internal mechanisms would require more than a statistical snapshot. The authors point to observations of galaxy kinematics across multiple redshifts as a way to investigate how lopsided patterns develop and persist over time.
The limits of the comparison
The large sample provides a broader statistical view, but its heterogeneous origins remain an important limitation. Different radial apertures and normalization choices can affect measured amplitudes, and the compilation is not volume-limited. Its completeness as a function of lopsidedness is unknown.
The robustness checks offer some reassurance that the main relationships are not simply artifacts of a few extreme values or one dominant source study. After the extreme measurements were excluded, the median A₁ and its relationship with rotation speed remained essentially unchanged. Among the 15 largest contributing source studies, no single source accounted for more than about 15 percent of the overall sample-averaged trend.
Even so, differences between source studies contribute to the scatter in the measurements and make the absolute comparison with simulations less straightforward. More uniform observations would help establish the typical amplitudes more precisely.
The A₁–A₂ relationship also deserves further examination. It is based on 302 galaxies, fewer than the full sample used for the lopsidedness analysis. A larger collection with both measurements could better constrain the slope and intercept and help clarify how the two modes are related.
For now, the observational sample and the simulation agree on a central pattern: lopsidedness tends to decline as galaxy mass and rotation speed increase. The statistical evidence points toward a role for internal galactic dynamics, while leaving open how disturbances are first generated, how they are amplified, and how much external events contribute to the asymmetry of individual disks.
The study was posted on the arXiv preprint server.