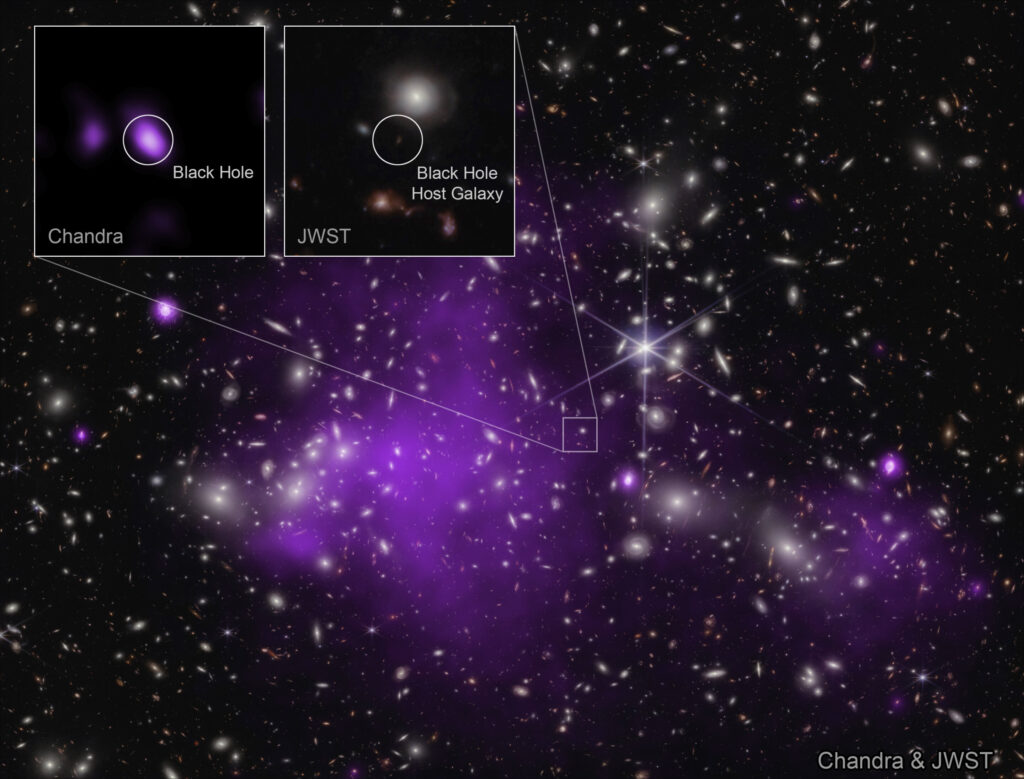
The same stellar explosion could appear in Earth’s sky twice, with nearly a lifetime separating the two appearances. First detected as SN Ares, the distant supernova is being magnified and split into multiple images by the gravity of a massive galaxy cluster. Astronomers predict that light from the explosion, already seen by the James Webb Space Telescope, could reach Earth again along two other paths roughly 70 to 80 years from now. Webb observations have also identified SN Ares as a rare Type IIb supernova, offering a detailed glimpse of a massive star that had shed much of its outer hydrogen before exploding, more than halfway back through the universe’s history.
The discovery brings together two unusual features of astronomy. SN Ares is a strongly gravitationally lensed supernova, meaning its light has been bent by the gravity of an enormous foreground galaxy cluster. It is also a spectroscopically identified Type IIb supernova at a redshift of 1.276, making it the highest-redshift member of this class identified through spectroscopy, according to the researchers.
The combination offers astronomers an opportunity to investigate the physical properties of a distant stellar explosion while potentially observing the same event at different times in the future.
The research team used observations from the James Webb Space Telescope (JWST) and the Hubble Space Telescope (HST), together with gravitational lens models of the galaxy cluster MACS J0308.9+2645. Their analysis establishes the supernova’s classification, estimates its stage of evolution and predicts when its other lensed images could become visible.
The predicted future appearances are particularly unusual. Rather than observing separate explosions, astronomers could see the same supernova’s light arriving through different gravitationally bent paths, with delays measured in decades.
A stellar explosion behind a massive galaxy cluster
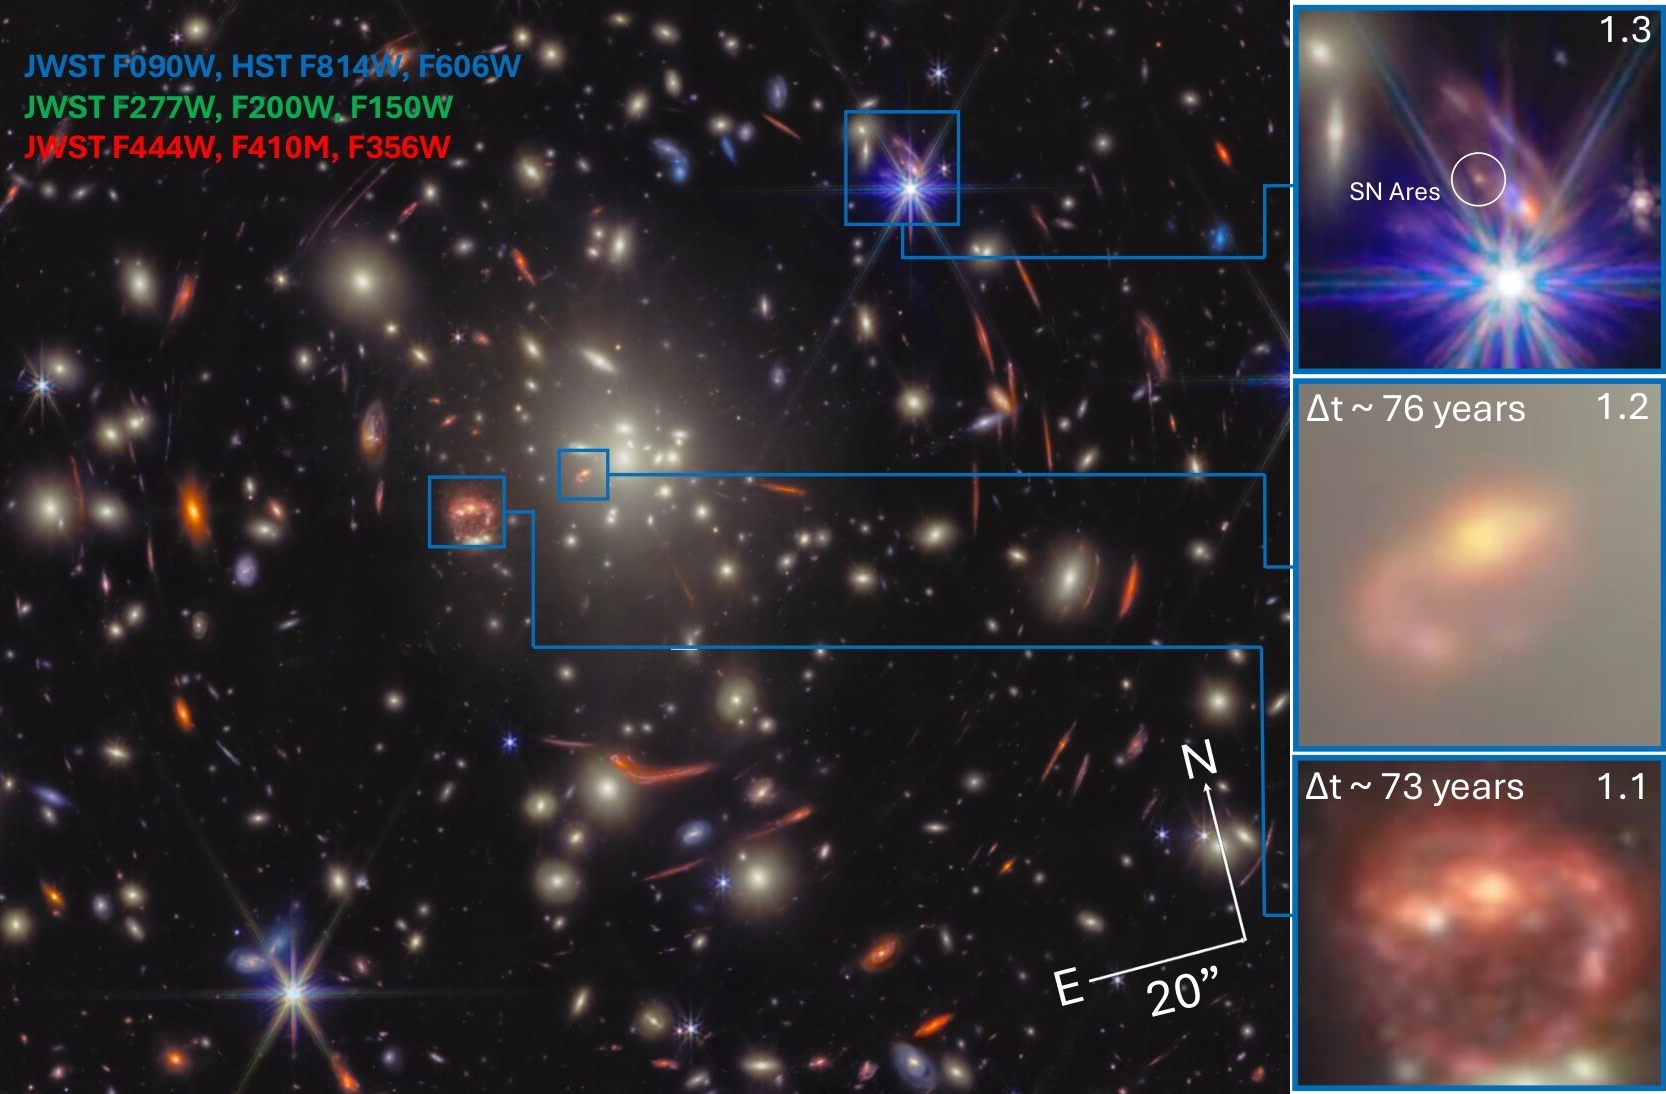
SN Ares was discovered on August 23, 2025, in JWST Near-Infrared Camera (NIRCam) observations of the galaxy cluster MACS J0308.9+2645.
The supernova lies within a large, star-forming galaxy behind the cluster. This background galaxy is itself strongly gravitationally lensed, appearing in multiple images because the cluster’s gravity bends its light.
Gravitational lensing occurs when a massive object lies between an observer and a more distant source of light. Its gravity changes the paths taken by light traveling toward Earth. Depending on the mass distribution and geometry of the system, light from a single background object can reach an observer along multiple paths.
These paths do not necessarily have the same length or pass through gravitational fields of identical strength. Consequently, their light can arrive at different times.
For SN Ares, the foreground cluster acts as a cosmic lens that produces three predicted images of the same background event. Astronomers have already detected the first image, identified as image 1.3 in the lensing system.
The other two images have not yet arrived.
The discovery was made particularly challenging by a bright foreground star near the supernova’s position. Its light contaminates observations of the background galaxy and makes it harder to distinguish the much fainter transient.
JWST’s high-resolution imaging helped reduce this contamination. Astronomers also compared the discovery images with observations obtained before the explosion, allowing them to identify the new source through image subtraction.
The earlier observations, collected on February 4, 2025, provided reference images of the field before SN Ares appeared. Subtracting these images from the later observations helped isolate the transient from the surrounding galaxy and foreground light.
The discovery data covered ten NIRCam filters, providing measurements across a broad range of infrared wavelengths.
The first observations measured apparent AB magnitudes of 26.793 in F115W, 25.641 in F150W, 25.453 in F200W, 25.600 in F300M, 25.872 in F410M and 25.639 in F444W.
A second JWST imaging epoch was obtained on September 23, 2025, approximately one month after discovery. This observation included additional F115W and F444W measurements, alongside a near-infrared spectrum obtained with JWST’s Near-Infrared Spectrograph (NIRSpec).
That spectrum became essential for determining what kind of supernova had exploded.
The spectrum identifies a partially stripped star
Supernovae produced by the collapse of massive stars are classified partly according to the chemical elements visible in their spectra.
Some retain substantial hydrogen envelopes, while others have lost much of their outer material before exploding. The amount of hydrogen and the presence of helium provide important clues about the structure of the progenitor star.
Type IIb supernovae occupy an intermediate position between hydrogen-rich Type II explosions and hydrogen-free Type Ib explosions.
Their progenitor stars have lost most, but not all, of their original hydrogen envelopes. As a result, their spectra can initially resemble those of hydrogen-rich supernovae before developing features associated with helium-rich, stripped-envelope explosions.
SN Ares displayed the combination of hydrogen and helium features needed to identify this unusual class.
The research team measured its redshift using emission lines from the host galaxy. These included [O II], Hβ, [O III], Hα, [N II], [S II], [S III], helium and hydrogen emission features.
The resulting spectroscopic redshift was z = 1.276 ± 0.002.
The NIRSpec spectrum covered rest-frame wavelengths from approximately 4,000 to 20,000 angstroms, spanning the optical and near-infrared portions of the supernova’s emitted light.
Among its most important features were helium lines at 5,876, 7,065 and 10,830 angstroms, together with Hα and the hydrogen Paschen-beta line, Paβ.
The helium features at 5,876 and 10,830 angstroms were detected at high significance. The 7,065-angstrom feature was weaker, with a detection significance of approximately 2.6 to 3.2 sigma, depending on how the surrounding continuum was defined.
The presence of Hα established that SN Ares was not a Type Ib or Type Ic supernova, which lack hydrogen signatures.
However, hydrogen alone could not distinguish a Type IIb explosion from an ordinary hydrogen-rich Type II supernova.
The relative strengths of the helium and hydrogen features provided the more important evidence.
Why the helium features matter
Helium can also become visible in ordinary Type II supernovae as they evolve. Therefore, simply detecting helium does not automatically establish a Type IIb classification.
The researchers instead examined how strong the helium lines were compared with the hydrogen features.
In SN Ares, the helium line at 5,876 angstroms was unusually prominent relative to Hα. The helium feature at 10,830 angstroms was also strong compared with the hydrogen Paβ line.
This combination favored a Type IIb interpretation over a conventional hydrogen-rich Type II classification.
The distinction became clearer when the researchers examined other expected spectral features.
If SN Ares were an ordinary Type II supernova observed at a sufficiently late stage, certain forbidden emission lines would be expected to emerge. These include features associated with oxygen, calcium and iron.
The spectrum did not show the prominent forbidden lines expected from a substantially later-stage Type II event.
Taken together, the hydrogen and helium features, their relative strengths and the absence of those expected forbidden lines supported the Type IIb classification.
The researchers also considered the possibility that some of the observed emission originated from the surrounding host galaxy rather than the supernova itself.
Despite their efforts to subtract the local background, substantial host-galaxy contamination remained in the blue portion of the spectrum and probably contributed to the Hα feature.
This matters because an additional hydrogen contribution from the host could make the supernova’s hydrogen emission appear stronger than it really was.
The authors noted that even a weaker intrinsic hydrogen feature would make the Type IIb interpretation more compelling.
Comparing SN Ares with nearby supernovae
Classifying SN Ares was only part of the challenge. The researchers also needed to determine how far the explosion had progressed when JWST obtained its spectrum.
Supernova spectra change as explosions evolve. Features associated with particular elements can strengthen or weaken, making spectral comparisons useful for estimating an event’s age relative to its peak brightness.
However, core-collapse supernovae do not all follow identical evolutionary patterns. Their spectral and brightness changes can differ substantially, making it difficult to assign a precise phase using a single comparison.
The researchers approached this problem by comparing SN Ares with observations of previously studied supernovae.
They assembled spectra from 11 Type IIb events, including SN 1993J, SN 1996cb, SN 2001ig, SN 2008aq, SN 2008ax, SN 2011dh, SN 2011fu, SN 2012dy, SN 2013cu, SN 2013df and PS15bgt.
Together, these objects contributed 432 spectra to the comparison sample.
The team used the Next Generation SuperFit classification software, modifying its spectral template collection to cover a wider range of Type IIb evolutionary stages.
They first compared the optical region containing the helium features at 5,876 and 7,065 angstroms and the Hα line.
The best matches included SN 1993J, SN 2011dh and SN 2011fu, three well-observed Type IIb supernovae.
The comparison suggested that SN Ares was observed approximately 15 to 35 days after the radioactive B-band maximum, although the individual spectral matches produced relatively broad uncertainties.
SN 1993J provided the closest overall match among the three comparison objects.
There were also differences.
Compared with the nearby supernovae, SN Ares appeared to have stronger Hα emission and a weaker calcium II near-infrared triplet, which consists of features near 8,498, 8,542 and 8,662 angstroms.
The authors considered whether these differences could reflect variations in the structure, mass or excitation of the progenitor’s remaining envelope.
However, the strengths of these spectral features also change with time. Their relative differences therefore cannot independently establish that the progenitor retained more hydrogen.
Residual emission from the host galaxy may also have affected the measured Hα profile.
The researchers consequently treated these differences as suggestive rather than definitive evidence of a distinct progenitor structure.
A second comparison using near-infrared spectra
The team also examined the near-infrared portion of the spectrum, comparing SN Ares with templates constructed from helium-rich stripped-envelope supernovae.
These templates included Type IIb and Type Ib events and covered a range of evolutionary stages from five days before the radioactive peak to 80 days afterward.
The researchers concentrated on the region between 8,200 and 12,000 angstroms.
This wavelength range contains the calcium II triplet and a blended feature involving helium and hydrogen near 10,830 angstroms. Both change in strength as the explosion evolves.
The comparison produced a spectroscopic phase estimate of 13 ± 12 days relative to the B-band maximum.
This estimate was earlier than the approximately 24 ± 12 days obtained from the optical comparisons with individual Type IIb supernovae.
The difference illustrates why determining the age of a core-collapse supernova from its spectrum can be difficult.
Not all spectral features evolve at exactly the same rate, and the best-fitting phase can depend on which features are emphasized.
In particular, the helium feature near 10,830 angstroms favored a later phase than the calcium II feature.
The researchers also found that the Paβ feature in SN Ares was stronger than in the overall stripped-envelope supernova population. Its relative strength more closely resembled the hydrogen-rich Type II population.
This raised the possibility that SN Ares retained more of its hydrogen envelope than typical nearby stripped-envelope supernovae.
However, the researchers cautioned that the comparison with individual, well-observed Type IIb events might provide a more reliable estimate than the population-level spectral comparison.
They therefore turned to the supernova’s brightness measurements to obtain a more consistent estimate of its evolutionary stage.
Light curves place the observation about one month after peak
A supernova’s light curve describes how its brightness changes over time.
For SN Ares, the researchers compared the JWST measurements with the light curves of SN 1993J, SN 2011dh and SN 2011fu, as well as a population-level collection of Type IIb light curves.
The comparisons required several corrections because the supernovae were observed at different distances, through different filters and under different amounts of dust extinction.
The team corrected the comparison supernovae for their known Milky Way and host-galaxy extinction. For SN Ares, they accounted for the Milky Way foreground extinction and treated additional host-galaxy reddening as a free parameter.
They also calculated corrections to account for the fact that JWST’s observed filters did not correspond exactly to the rest-frame filters used for the nearby comparison supernovae.
To reconstruct the brightness evolution between available observations, the researchers used Gaussian-process models. These provide smooth estimates of a light curve while accounting for measurement uncertainties.
The fitting procedure considered four main parameters: the phase of SN Ares, a common brightness offset, additional reddening from its host galaxy and intrinsic scatter between the comparison light curves and the observations.
The brightness offset also incorporates the effects of gravitational magnification and redshift-dependent corrections.
The researchers used a statistical sampling method to estimate the most likely values and their uncertainties.
The results were notably consistent across the different comparisons.
When compared with SN 1993J, SN Ares had an estimated phase of 31 days after the radioactive B-band maximum, with an uncertainty extending approximately five days earlier and 11 days later.
The comparison with SN 2011dh produced an estimate of 34 days, with uncertainties of minus five and plus 10 days.
The SN 2011fu comparison yielded 31 days, with uncertainties of minus nine and plus 13 days.
Finally, the population-level Type IIb templates produced an estimate of 34 days, with uncertainties of minus nine and plus 10 days.
All phase measurements refer to the rest frame of the supernova.
These results place the second JWST observation approximately one month after the radioactive B-band maximum.
The consistency between three individual supernova comparisons and the broader Type IIb population provides stronger support for this estimate than the less precise spectral comparisons alone.
The researchers also noted that the statistical distributions were asymmetric, with some comparisons allowing a secondary solution at a later phase. The reported uncertainties account for this uneven distribution rather than assuming that the possible phases are distributed symmetrically around the central estimate.
The resulting phase estimates were consistent within their uncertainties with the earlier spectroscopic analysis.
SN Ares was not unusually bright
The researchers also used the light-curve comparisons to estimate how bright SN Ares would have appeared without gravitational magnification.
This required accounting for the distance to the supernova, the magnification produced by the foreground cluster, the brightness differences between the comparison events and the effects of redshift.
Using a magnification of 5.6 ± 0.5 from their primary lens model, the researchers estimated that SN Ares had an intrinsic peak absolute B-band magnitude between approximately −17.1 and −17.9, depending on which comparison supernova was used.
These estimates were consistent with the luminosity distribution of nearby Type IIb supernovae.
The researchers therefore found no need to invoke an unusually luminous explosion to explain the observations.
Gravitational lensing increased the apparent brightness of SN Ares by approximately 1.9 magnitudes, making it possible to obtain a detailed spectrum of an event whose inferred intrinsic brightness was comparable to that of nearby Type IIb supernovae.
The result also helps distinguish the brightness enhancement caused by lensing from the actual luminosity of the exploding star.
The same explosion could appear again in the 2090s
The supernova’s unusual classification is only one part of the discovery. Its position behind MACS J0308.9+2645 also creates the possibility of observing the same explosion again after a remarkably long delay.
The researchers constructed three independent gravitational lens models of the cluster to estimate when the other images of SN Ares would reach Earth.
These models use the distribution of mass in the foreground cluster and the positions of multiple background galaxies whose light is distorted by the cluster’s gravity.
The models are not identical, but all three predict that the image already detected is the first to arrive.
The first model, constructed using the Lenstool software, incorporates 48 multiple images belonging to 15 independent background-source families. Two of those families have spectroscopic redshifts, while the others rely on photometric redshift estimates derived from combined Hubble and JWST observations.
This model estimates a magnification of 5.6 ± 0.5 for the currently observed supernova image.
Assuming a Hubble constant of 70 kilometers per second per megaparsec, it predicts that the second image will arrive approximately 70 ± 1 years after the first.
The third image is predicted to arrive approximately 73 ± 1 years after the first.
The corresponding magnifications are 4.9 ± 0.1 for the second image and 1.5 ± 0.1 for the third.
A second model, constructed with the glafic software, produces similar results.
It estimates a magnification of 4.7 ± 0.3 for the observed image, with the second and third appearances predicted approximately 72 ± 2 years and 77 ± 4 years later, respectively.
A third model, developed using the AstroLensPy approach, predicts somewhat longer delays.
It estimates a magnification of 4.6 ± 0.4 for the current image and predicts that the second image will arrive after 76.4 ± 0.3 years, followed by the third after 79.1 ± 0.4 years.
Predicted appearances of SN Ares
Time delays measured relative to the image already observed in 2025. Values depend on the gravitational lens model.
- First image — already observed 2025 · Magnification approximately 4.6–5.6
- Second image — predicted Approximately 2095–2101 · Magnification approximately 4.9 in the Lenstool model
- Third image — predicted Approximately 2098–2104 · Magnification approximately 1.5 in the Lenstool model
Calendar years are approximate and illustrate the different model predictions, not confirmed arrival dates.
Although the exact timing differs between models, their predictions consistently place the other two appearances several decades after the first.
The researchers emphasize that the arrival order is determined by the geometry of the gravitational lensing system and does not depend on which of the three models is used.
The predicted delays do, however, depend on the assumed cosmological parameters.
For example, the team estimates that changing the adopted Hubble constant by 3 kilometers per second per megaparsec would change the predicted delays by approximately five years. A lower value would produce a longer delay.
This means that improving the lens model and refining the cosmological assumptions will be important for predicting when the future images will arrive.
Why the future images could help measure the universe
The long delays also connect SN Ares to a method known as time-delay cosmography.
The underlying idea is that light from a distant object can reach Earth along different gravitationally bent paths. Because those paths experience different geometries and gravitational delays, their arrival times are not identical.
If astronomers can observe the same transient event in multiple images and measure the differences in their arrival times, they can use those measurements together with a model of the foreground lens to constrain distances and cosmological parameters.
One important parameter is the Hubble constant, H₀, which describes the present-day expansion rate of the universe.
Strongly lensed supernovae are particularly useful for this approach because their brightness changes over time in recognizable ways. A supernova’s light curve can provide identifiable features, including its radioactive peak, that help astronomers compare different images of the same event.
SN Ares could provide an unusually long time baseline for this kind of measurement.
The researchers note that its predicted delays are substantially longer than those of other discovered strongly lensed supernova systems.
However, the future measurement will depend on more than simply detecting the later images. Astronomers will also need an accurate model of the cluster’s mass distribution.
The gravitational lens models currently available have uncertainties arising from the complexity of the cluster and the limited information available about the redshifts of its multiple background sources.
The team expects additional observations to improve these constraints.
More observations are needed to refine the predictions
JWST observations of MACS J0308.9+2645 are scheduled to provide additional spectroscopic information about the cluster’s multiply imaged background galaxies.
The researchers specifically identify planned JWST/NIRSpec Multi-Object Spectroscopy observations in early 2027 as an important next step.
These observations should provide more spectroscopic redshifts, helping refine the gravitational lens models and assess the stability of the predicted arrival times and magnifications.
They may also help resolve another uncertainty in the supernova analysis.
Because the spectrum of SN Ares still contains emission from its host galaxy, some of the measured spectral features may not originate entirely from the explosion.
The researchers plan to obtain a spectrum of the host galaxy at the supernova’s location after the transient has faded. This would provide a more direct way to subtract the host contribution and distinguish the supernova’s intrinsic emission from the surrounding galaxy.
The Hubble observations have not yet provided a comparable detection of the supernova’s light-curve evolution.
Five HST/WFC3 observations were obtained after the JWST discovery, but the nearby foreground star and the lower spatial resolution of Hubble made the measurements difficult.
The team derived approximate 3-sigma upper limits in the F160W filter, ranging from magnitudes fainter than 25.30 to fainter than 24.83 across the five observations.
These limits were not sufficiently constraining to establish the supernova’s evolution. The researchers explain that observations using a reference image with a more closely matched position angle could produce cleaner difference images and potentially allow detections.
What the explosion suggests about its progenitor
The spectral resemblance between SN Ares and nearby Type IIb supernovae also raises questions about the star that produced it.
The three closest local comparisons, SN 1993J, SN 2011dh and SN 2011fu, have all been associated with binary progenitor systems.
Based on the similarities, the researchers suggest that SN Ares may also have originated from a higher-multiplicity stellar system, in which more than one star was involved.
Such a possibility is relevant because the remaining hydrogen envelope of a Type IIb progenitor is an important part of its observed spectral behavior.
However, the researchers cannot directly determine the progenitor system from the available observations.
The apparent differences in hydrogen emission between SN Ares and its nearby counterparts could reflect differences in the remaining envelope, but they could also result from the supernova’s evolutionary phase or contamination from the host galaxy.
The authors also point out that finding a Type IIb event among the fewer than 10 spectroscopically observed strongly lensed supernovae is interesting because this class represents a relatively small fraction of nearby Type II explosions.
They cite an estimated local Type IIb rate of approximately 7% of Type II supernovae.
Nevertheless, a single distant event cannot establish whether the proportions of different supernova types or their progenitor systems have changed over cosmic time.
More spectroscopically confirmed lensed supernovae would be needed to investigate that possibility.
For now, SN Ares provides a detailed example of a Type IIb explosion at a redshift of 1.276, with spectral features that broadly resemble those of well-studied nearby events.
Its other two gravitationally lensed images remain predictions. Their eventual arrival will depend on the accuracy of the evolving lens models and the ability of future observatories to monitor the cluster over the coming decades.
The study was posted to the arXiv preprint server.