Across 200 hours of observations, astronomers have produced exceptionally deep, high-resolution images of a large region of the radio sky, revealing nearly 63,000 unique radio sources across a field measuring 2.5 by 2.5 square degrees. The observations, made with the international LOFAR radio telescope network, reached a central point-source sensitivity of 5.3 microjanskys per beam at a resolution of 0.33 by 0.39 arcseconds. These images offer an unusually detailed view of faint radio emission, including structures in distant galaxies that can be difficult to distinguish in lower-resolution observations.
The observations cover a region known as ELAIS-N1, a well-studied area of the sky that has previously been examined using radio telescopes and instruments operating at other wavelengths. The new images were produced using the Low Frequency Array (LOFAR), an international network of radio antennas that observes the universe at relatively long wavelengths.
The work addresses a longstanding technical challenge in radio astronomy: producing extremely sensitive images over a large area of sky while retaining enough angular resolution to distinguish closely spaced sources and resolve their internal structures.
Combining hundreds of hours of observations is not simply a matter of adding more data. The signals must be carefully calibrated to correct for instrumental effects, disturbances caused by Earth’s ionosphere, and differences between observations. Processing such enormous datasets also requires substantial computing resources.
The team, led by J.M.G.H.J. de Jong, combined recent advances in calibration, imaging, and automated data processing to overcome these difficulties. Their results establish a new depth benchmark for low-frequency radio imaging below 1.28 gigahertz.
200 hours of observations across the European LOFAR network
LOFAR uses antennas distributed across several European countries. By combining signals from widely separated stations, astronomers can effectively create a much larger radio telescope than any individual station.
The distance between antennas, known as the baseline, determines the telescope’s ability to distinguish fine details. LOFAR’s international stations provide baselines extending up to approximately 1,980 kilometers across Europe, allowing observations at resolutions below one arcsecond.
For this project, the researchers selected 25 observations of ELAIS-N1, recorded between 2018 and 2021. Together, they provided 200 hours of observing time in the 115–168 megahertz frequency range.
Although 505 hours of LOFAR observations were available for the field, the team selected only 200 hours for the high-resolution imaging. The remaining observations were unsuitable because some lacked the distant international stations needed for sub-arcsecond resolution, while others had time intervals that would produce excessive smearing or suffered from elevated noise and substantial data loss during calibration.
The selected observations came from two observing projects. Some had been recorded with a time resolution of one second, while others used two-second intervals. These differences later became important when the team assessed the quality of the final images.
The observations were processed through several calibration stages. First, the researchers corrected instrumental and ionospheric effects using observations of the radio source 3C 295. They then calibrated the signals from the Dutch stations and extended the calibration to the international stations.
A particularly important part of the process involved direction-dependent calibration. Radio signals traveling through different parts of Earth’s ionosphere can experience different distortions, so a single correction cannot adequately describe the entire field of view. The team divided the sky into 24 regions, or facets, each associated with a calibrator source.
This allowed the researchers to derive corrections for different directions across the field before combining the observations.
They also used automated quality assessment and calibration procedures to reduce the need for manual intervention. These developments made it possible to process numerous observations in parallel rather than treating the entire dataset as one enormous computational task.
Turning hundreds of terabytes of data into detailed images
The computational demands of the project were substantial. The observations initially contained enormous quantities of radio interferometric data, representing measurements of the signals received by pairs of telescope stations.
After calibration and other processing steps, the combined facet datasets contained approximately 200 terabytes of compressed visibility data.
Processing all 25 observations required approximately 750,000 CPU core-hours. About 10 percent of that computing time was spent on imaging.
One of the most important techniques was sidereal visibility averaging, or SVA. This method combines calibrated measurements from different observing sessions when their baseline coordinates are sufficiently similar.
Because the observations were taken at different times, their measurements do not all correspond to identical positions in the telescope’s observing geometry. SVA takes advantage of the similarities between these measurements to reduce the amount of data that must be handled during the final imaging stage.
The researchers reduced the combined number of calibrated and facet-subtracted visibilities by a factor of 12.5. This lowered the computational cost of gridding and prediction during imaging by approximately an order of magnitude.
Without this averaging, the data would have been considerably more expensive to process.
The team performed the final imaging at three principal angular resolutions, using Gaussian tapers of 0.3, 0.6, and 1.2 arcseconds. These produced mosaics with restoring beams of approximately 0.36 by 0.45, 0.58 by 0.62, and 1.0 by 1.5 arcseconds, respectively.
The highest-resolution images provide the finest view of compact radio sources, while the lower-resolution images retain greater sensitivity to diffuse emission spread across larger areas.
The distinction is important because radio galaxies can contain both compact central components and extensive structures such as jets and lobes. An image that resolves the smallest details does not necessarily capture all the faint, extended emission.
The deepest low-frequency radio images in the comparison
The final images reached a central point-source sensitivity of 5.3 microjanskys per beam at an angular resolution of 0.33 by 0.39 arcseconds.
Across the entire 2.5-by-2.5-degree field, the area-weighted root-mean-square noise was 7.4 microjanskys per beam at a resolution of 0.36 by 0.45 arcseconds.
A microjansky is one-millionth of a jansky, the unit commonly used to measure astronomical radio flux density. Lower noise means that fainter radio sources can potentially be distinguished from the background.
The researchers compared their results with previous LOFAR observations of ELAIS-N1.
In an earlier study, de Jong and colleagues used 32 hours of observations to produce sub-arcsecond images with a central sensitivity of 14 microjanskys per beam. The new observations improve that sensitivity by a factor of 2.6.
The improvement is consistent with the expected relationship between observing time and sensitivity, in which noise decreases approximately with the square root of the total integration time.
Another comparison involved a much longer LOFAR observing campaign by Shimwell and colleagues, which used 505 hours of data from the Dutch stations. That survey reached a central sensitivity of approximately 10 microjanskys per beam, but at a substantially lower resolution of 6 arcseconds.
Despite using fewer observing hours, the new images reached approximately twice the sensitivity at their respective central point-source measurements.
The researchers attribute this improvement partly to the larger collecting area and greater sensitivity provided by the international stations. The much finer angular resolution also reduces confusion noise, a problem that limits extremely deep observations when numerous faint sources overlap within the same telescope beam.
The team additionally compared the new images with deep radio surveys at other frequencies. Using the area-weighted noise within the central 1.5-by-1.5-degree region, they measured 5.8 microjanskys per beam.
Their comparison identifies the ELAIS-N1 image as the most sensitive radio image below 1.28 gigahertz among the surveys examined.
Comparisons with observations at higher frequencies depend on the assumed radio spectral index, which describes how a source’s brightness changes with observing frequency. The relative sensitivity therefore varies depending on the type of radio source being considered.
For a spectral index of −1, the LOFAR image has an equivalent point-source sensitivity comparable to the MeerKAT DEEP2 image. For a spectral index near −0.8, typical of synchrotron-dominated radio sources, MeerKAT DEEP2 remains more sensitive. For a spectral index near −0.5, measured for star-forming galaxies in ELAIS-N1, several higher-frequency images are more sensitive.
The comparisons therefore depend on both observing frequency and the radio emission characteristics of the sources.
Nearly 63,000 radio sources in one catalogue
The researchers combined their new high-resolution source detections with an existing deep LOFAR catalogue at 6-arcsecond resolution.
They generated separate catalogues at 0.3, 0.6, and 1.2 arcseconds using the PyBDSF source-finding software. They then matched these detections with the previously released 6-arcsecond catalogue.
Before combining the catalogues, the team applied a signal-to-noise threshold to remove unreliable detections.
They calculated the local noise around individual sources and required each source’s peak intensity to be at least five times the local root-mean-square noise. This approach produced a cleaner catalogue than relying on integrated flux density alone, although it also removed some potentially real faint sources.
The filtering removed approximately 40 percent of the initial sources at 0.3-arcsecond resolution, 23 percent at 0.6 arcseconds, 27 percent at 1.2 arcseconds, and 20 percent at 6 arcseconds.
The researchers retained the unfiltered source-finder outputs as well, allowing other investigators to examine individual faint detections while recognizing that these less restrictive catalogues contain unreliable sources.
After filtering and cross-matching, the combined catalogue contained 63,841 rows representing 62,916 unique radio sources.
The distinction between rows and unique sources arises because a radio source can appear as one object at lower resolution but separate into multiple components at higher resolution. The catalogue preserves these different detections rather than treating every component as an entirely independent astronomical source.
Of the 62,916 unique sources, 50.5 percent were detected at more than one resolution, while 25.5 percent appeared in all four.
The source density varied with angular resolution. The 0.3-arcsecond catalogue contained approximately 4,954 sources per square degree, compared with 4,828 at 0.6 arcseconds, 4,105 at 1.2 arcseconds, and 7,661 at 6 arcseconds.
The different counts reflect the fact that no single resolution detects every type of radio source equally well.
Within the central 0.3 degrees of the field, approximately 40 percent of sources were detected at only one resolution. Most of these single-resolution detections appeared in the 6-arcsecond catalogue, suggesting that many are faint or extended sources that fall below the detection threshold in the higher-resolution images.
Farther from the field’s center, the fraction detected at all four resolutions decreases, while detections appearing only at 6 arcseconds become more common. The researchers associate this pattern with increasing time and bandwidth smearing and the narrower primary beam of the international stations.
Why some galaxies disappear at higher resolution
The differences between the catalogues provide an important view of how angular resolution affects radio-source detection.
Higher resolution makes it easier to distinguish compact sources and separate individual components of radio galaxies. However, it reduces sensitivity to emission distributed over larger areas.
Lower-resolution images have the opposite advantage. They are better at capturing extended structures, although multiple nearby sources can blend together into a single detection.
The researchers examined source counts at all four resolutions and found that the 0.3-arcsecond images detect some of the faintest radio sources because of their higher point-source sensitivity.
However, this advantage does not hold across the entire range of measured brightness.
At integrated flux densities around 70 microjanskys, the 6-arcsecond images detect more sources than the 0.3-arcsecond images. The 0.6-arcsecond images also detect more sources than the highest-resolution images at flux densities around 100 microjanskys.
The team investigated whether this difference could be explained by smearing near the edges of the field. They repeated the comparison using sources within 0.5 degrees of the field center, where smearing is relatively small.
The difference remained. The 6-arcsecond and 0.6-arcsecond images still detected more sources than the 0.3-arcsecond images above approximately 70 microjanskys.
This indicates that smearing is not the only explanation.
The researchers attribute the remaining difference partly to the loss of surface brightness sensitivity at higher resolution and partly to the fact that some star-forming galaxies are sufficiently extended to become resolved in the finest images.
Star-forming galaxies dominate the source population at these flux densities. When their radio emission is spread across a larger area, their peak brightness can fall below the detection threshold even if their total emission remains measurable at lower resolution.
The authors discuss galaxies at redshifts around 1 as an example. Typical star-forming galaxies at these distances can be large enough to be resolved at approximately 0.3 arcseconds while remaining point-like at 0.6 arcseconds.
The team also compared integrated flux densities for individual sources detected at multiple resolutions.
For single-component sources detected in both images, the median ratio of the measured flux density at 0.3 arcseconds to that at 0.6 arcseconds was 0.97. The corresponding ratios were 0.89 when compared with 1.2-arcsecond images and 0.84 when compared with 6-arcsecond images.
These measurements indicate that progressively higher angular resolution can recover less of the total emission from sources with extended structures.
The effect also changes with source brightness.
At the lowest flux densities, the ratios approach or exceed unity, particularly in the comparison with 1.2-arcsecond images. This reflects the higher point-source sensitivity of the finest images, which helps recover faint compact sources.
At approximately 500–800 microjanskys, the ratios decline. In this range, brighter star-forming galaxies tend to be larger, and some of their emission can be resolved out at higher resolution.
At still higher flux densities, the ratios increase again as radio-loud active galactic nuclei become more dominant. The researchers note that their selection of single-component sources favors compact AGN cores, which are expected to have more similar measured flux densities across different resolutions.
The results demonstrate why the combined catalogue contains more useful source information than any individual resolution catalogue.
Smearing reduces the brightness of distant sources in the images
Despite the sensitivity achieved, the observations have an important limitation.
Time and bandwidth smearing reduce the peak brightness of radio sources, particularly toward the outer edges of the observed field.
Bandwidth smearing occurs because a telescope records signals across finite frequency channels. This can make sources appear stretched radially relative to the center of the field.
Time smearing occurs when signals are averaged over finite time intervals. It produces blurring along the tangential direction.
Both effects reduce peak intensity, making faint sources harder to detect.
The problem becomes more severe at higher angular resolution. According to the researchers’ calculations, a point source observed with typical LOFAR data recorded at one-second intervals and channel widths of 12.21 kilohertz can lose approximately half its peak intensity at 0.3-arcsecond resolution and a distance of 1.25 degrees from the field center.
The new dataset includes observations recorded at two-second intervals, which increases the effects.
The researchers estimated that time and bandwidth smearing could reduce peak intensities by as much as 80 percent at the outer edge of the field in the 0.3-arcsecond images. The lower-resolution images are less affected.
Additional averaging during data processing also contributes to smearing, particularly near the boundaries of individual facets.
The team examined ionospheric effects separately by comparing observations taken under relatively calm and disturbed ionospheric conditions. They selected compact sources with peak intensities exceeding ten times the local noise and compared their peak intensities with their integrated flux densities.
For the observation taken under more disturbed ionospheric conditions, this ratio was, on average, 15 ± 5 percent lower.
This indicates that ionospheric conditions also introduce peak-intensity losses, although the researchers found these effects to be smaller than the intrinsic time and bandwidth smearing in their highest-resolution images.
Sidereal visibility averaging introduces additional smearing through changes in Earth’s orientation and motion over time. However, the researchers reduced this contribution by oversampling the time axis by a factor of two. They estimate that the remaining effect is only a few percent at the field’s edge.
These limitations affect the completeness of the source catalogue, particularly at 0.3-arcsecond resolution, because the team used peak intensity rather than integrated flux density to determine which detections were reliable.
The researchers also note that they have not quantified the catalogue’s completeness through simulations at each resolution. Such simulations would need to account for differences in surface brightness sensitivity, source structure, time and bandwidth smearing, and false detections.
Confusion noise is not limiting the deepest images
Another major challenge in deep radio astronomy is confusion noise.
This occurs when numerous faint radio sources overlap within the same telescope beam. Their combined signals create a background that can resemble random noise, making it increasingly difficult to distinguish individual sources.
The problem becomes particularly important in deep, low-resolution observations because larger beams cover more of the sky.
Previous LOFAR observations using only Dutch stations have encountered this limitation. After several hundred hours of observing, confusion noise can prevent substantial improvements in sensitivity, even when more observing time is added.
The new images avoid this problem through their much finer angular resolution.
The researchers estimate that confusion noise scales approximately with the square of the beam size. As a result, an image at 0.3-arcsecond resolution can reach approximately 400 times deeper before confusion becomes limiting compared with a 6-arcsecond image.
To estimate the potential contribution, the team used measurements from the earlier 6-arcsecond ELAIS-N1 observations. Those images had a central RMS noise of 10.7 microjanskys per beam, compared with an estimated thermal noise of 7.5 microjanskys per beam.
The difference implies a confusion-noise contribution of approximately 7.6 microjanskys per beam at that resolution.
Scaling this estimate to 0.3 arcseconds, the researchers calculate that confusion noise would become relevant only when the thermal noise approaches approximately 20 nanjanskys per beam.
Reaching that sensitivity with the international LOFAR stations would require on the order of 20 million hours of observing time, according to their estimate.
That is far beyond LOFAR’s operational lifetime.
However, the absence of a confusion-noise limit does not mean that sensitivity can improve indefinitely. The researchers identify other potential restrictions, including sidelobe confusion from sources outside the observed field, remaining calibration errors, and limitations in image dynamic range around bright sources.
Deep observations also recover polarized radio emission
The team also examined the quality of the observations for studying radio polarization.
Radio waves can have different polarization properties, which provide information about the physical conditions associated with their emission and propagation.
For this part of the project, the researchers corrected instrumental polarization leakage using an unpolarized calibrator and aligned the polarization angles across the separate observations using the known polarized radio source 7C 1604+5447.
After calibration, they measured instrumental leakage from total intensity into linear polarization of 0.12 percent. The corresponding leakage into circular polarization was 0.02 percent.
The linear polarization leakage is approximately half the typical value reported for the LOFAR Two-metre Sky Survey at 6-arcsecond resolution.
To demonstrate the quality of the polarization data, the researchers compared observations using eight hours and 200 hours of LOFAR data.
They performed rotation-measure synthesis on Stokes Q and U images, which describe the two components of linearly polarized radio emission. This analysis produces Faraday dispersion functions that help identify polarized emission at different Faraday depths.
The 200-hour dataset produced considerably less noisy Faraday dispersion functions than the single eight-hour observation.
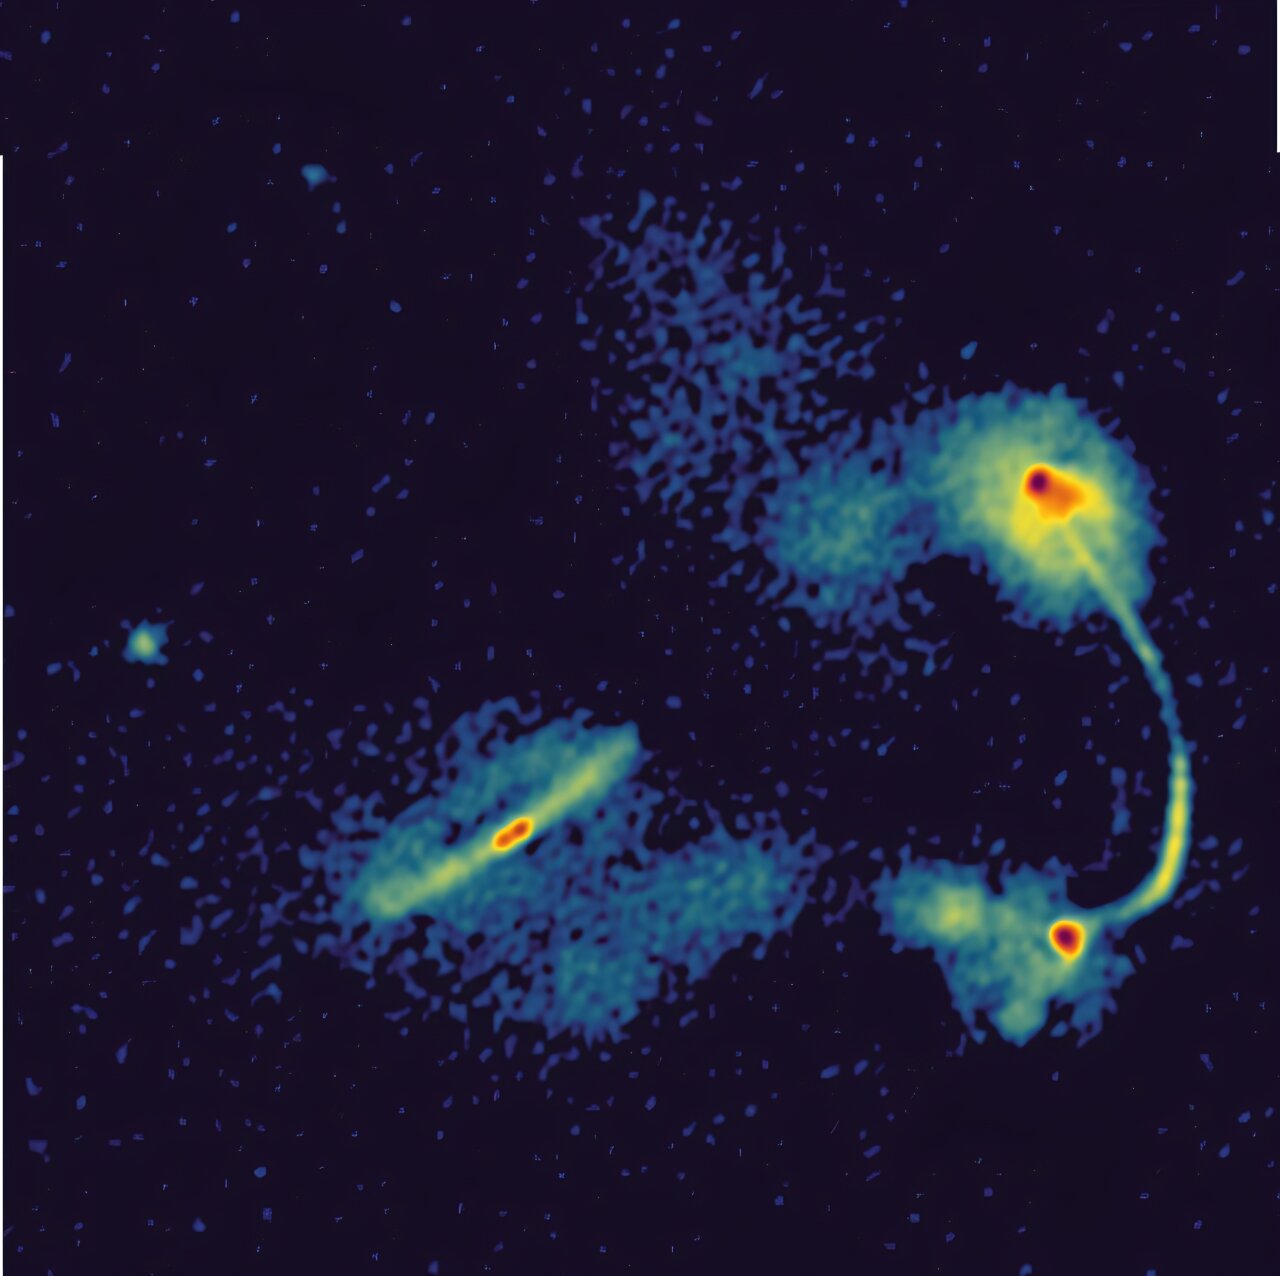
The deeper images also recovered more prominent linearly polarized emission from the radio galaxy’s hotspots. An extended feature identified as the southern lobe was visible farther toward the central host galaxy.
The researchers measured a rotation measure of 6.29 ± 0.01 radians per square meter for the southern hotspot. The northern hotspot had a value of 6.06 ± 0.07 radians per square meter, while the southern lobe measured 5.66 ± 0.05 radians per square meter.
The measured polarization fractions were 2.10 ± 0.02 percent for the northern hotspot and 0.54 ± 0.07 percent for the southern hotspot.
These measurements are consistent with previously reported values for the same source.
The researchers emphasize that a more comprehensive analysis of the field’s polarization properties remains to be completed. Future work will examine leakage across the field, beam depolarization, and the possibility of detecting additional polarized sources. Circular polarization will also be investigated separately.
Preparing deeper observations with LOFAR
The researchers discuss how their processing approach could be extended to much larger datasets.
One planned project is the LOFAR2.0 Ultra Deep Observation, which aims to image approximately 3,200 hours of LOFAR data from the Euclid Deep Field North.
The planned observations target a depth of 2 microjanskys per beam across the central 3.7 square degrees.
The project will combine deep optical and near-infrared observations from the Euclid Deep Survey with high-resolution, low-frequency radio images.
Processing thousands of hours of observations will require further reductions in computational costs. The researchers identify the LOFAR Enhanced Network for Sharp Surveys project as part of the effort to improve the processing pipeline, including the potential use of graphics processing units to accelerate calibration and imaging.
They also discuss the different limitations expected for the upcoming Square Kilometre Array Low.
Although SKA-Low will operate at similar frequencies to LOFAR and provide substantially higher sensitivity, its current maximum baseline length of 73.4 kilometers is expected to make it confusion-limited within a few hours, depending on its array configuration. The researchers argue that extending its maximum baselines would be necessary for it to surpass the sensitivities achieved in their highest-resolution LOFAR images.
The ELAIS-N1 images and catalogues have been made publicly available through the SURF Data Repository, together with data-provenance information. The release includes the individual facet images, mosaics, and source catalogues at their different angular resolutions.
The study does not establish the completeness of the final source catalogue through dedicated simulations, and the authors identify time and bandwidth smearing as an important limitation, particularly for the faintest sources toward the edges of the field. The detailed polarization properties of the full dataset also remain under investigation.
The paper is currently available on the arXiv preprint server.