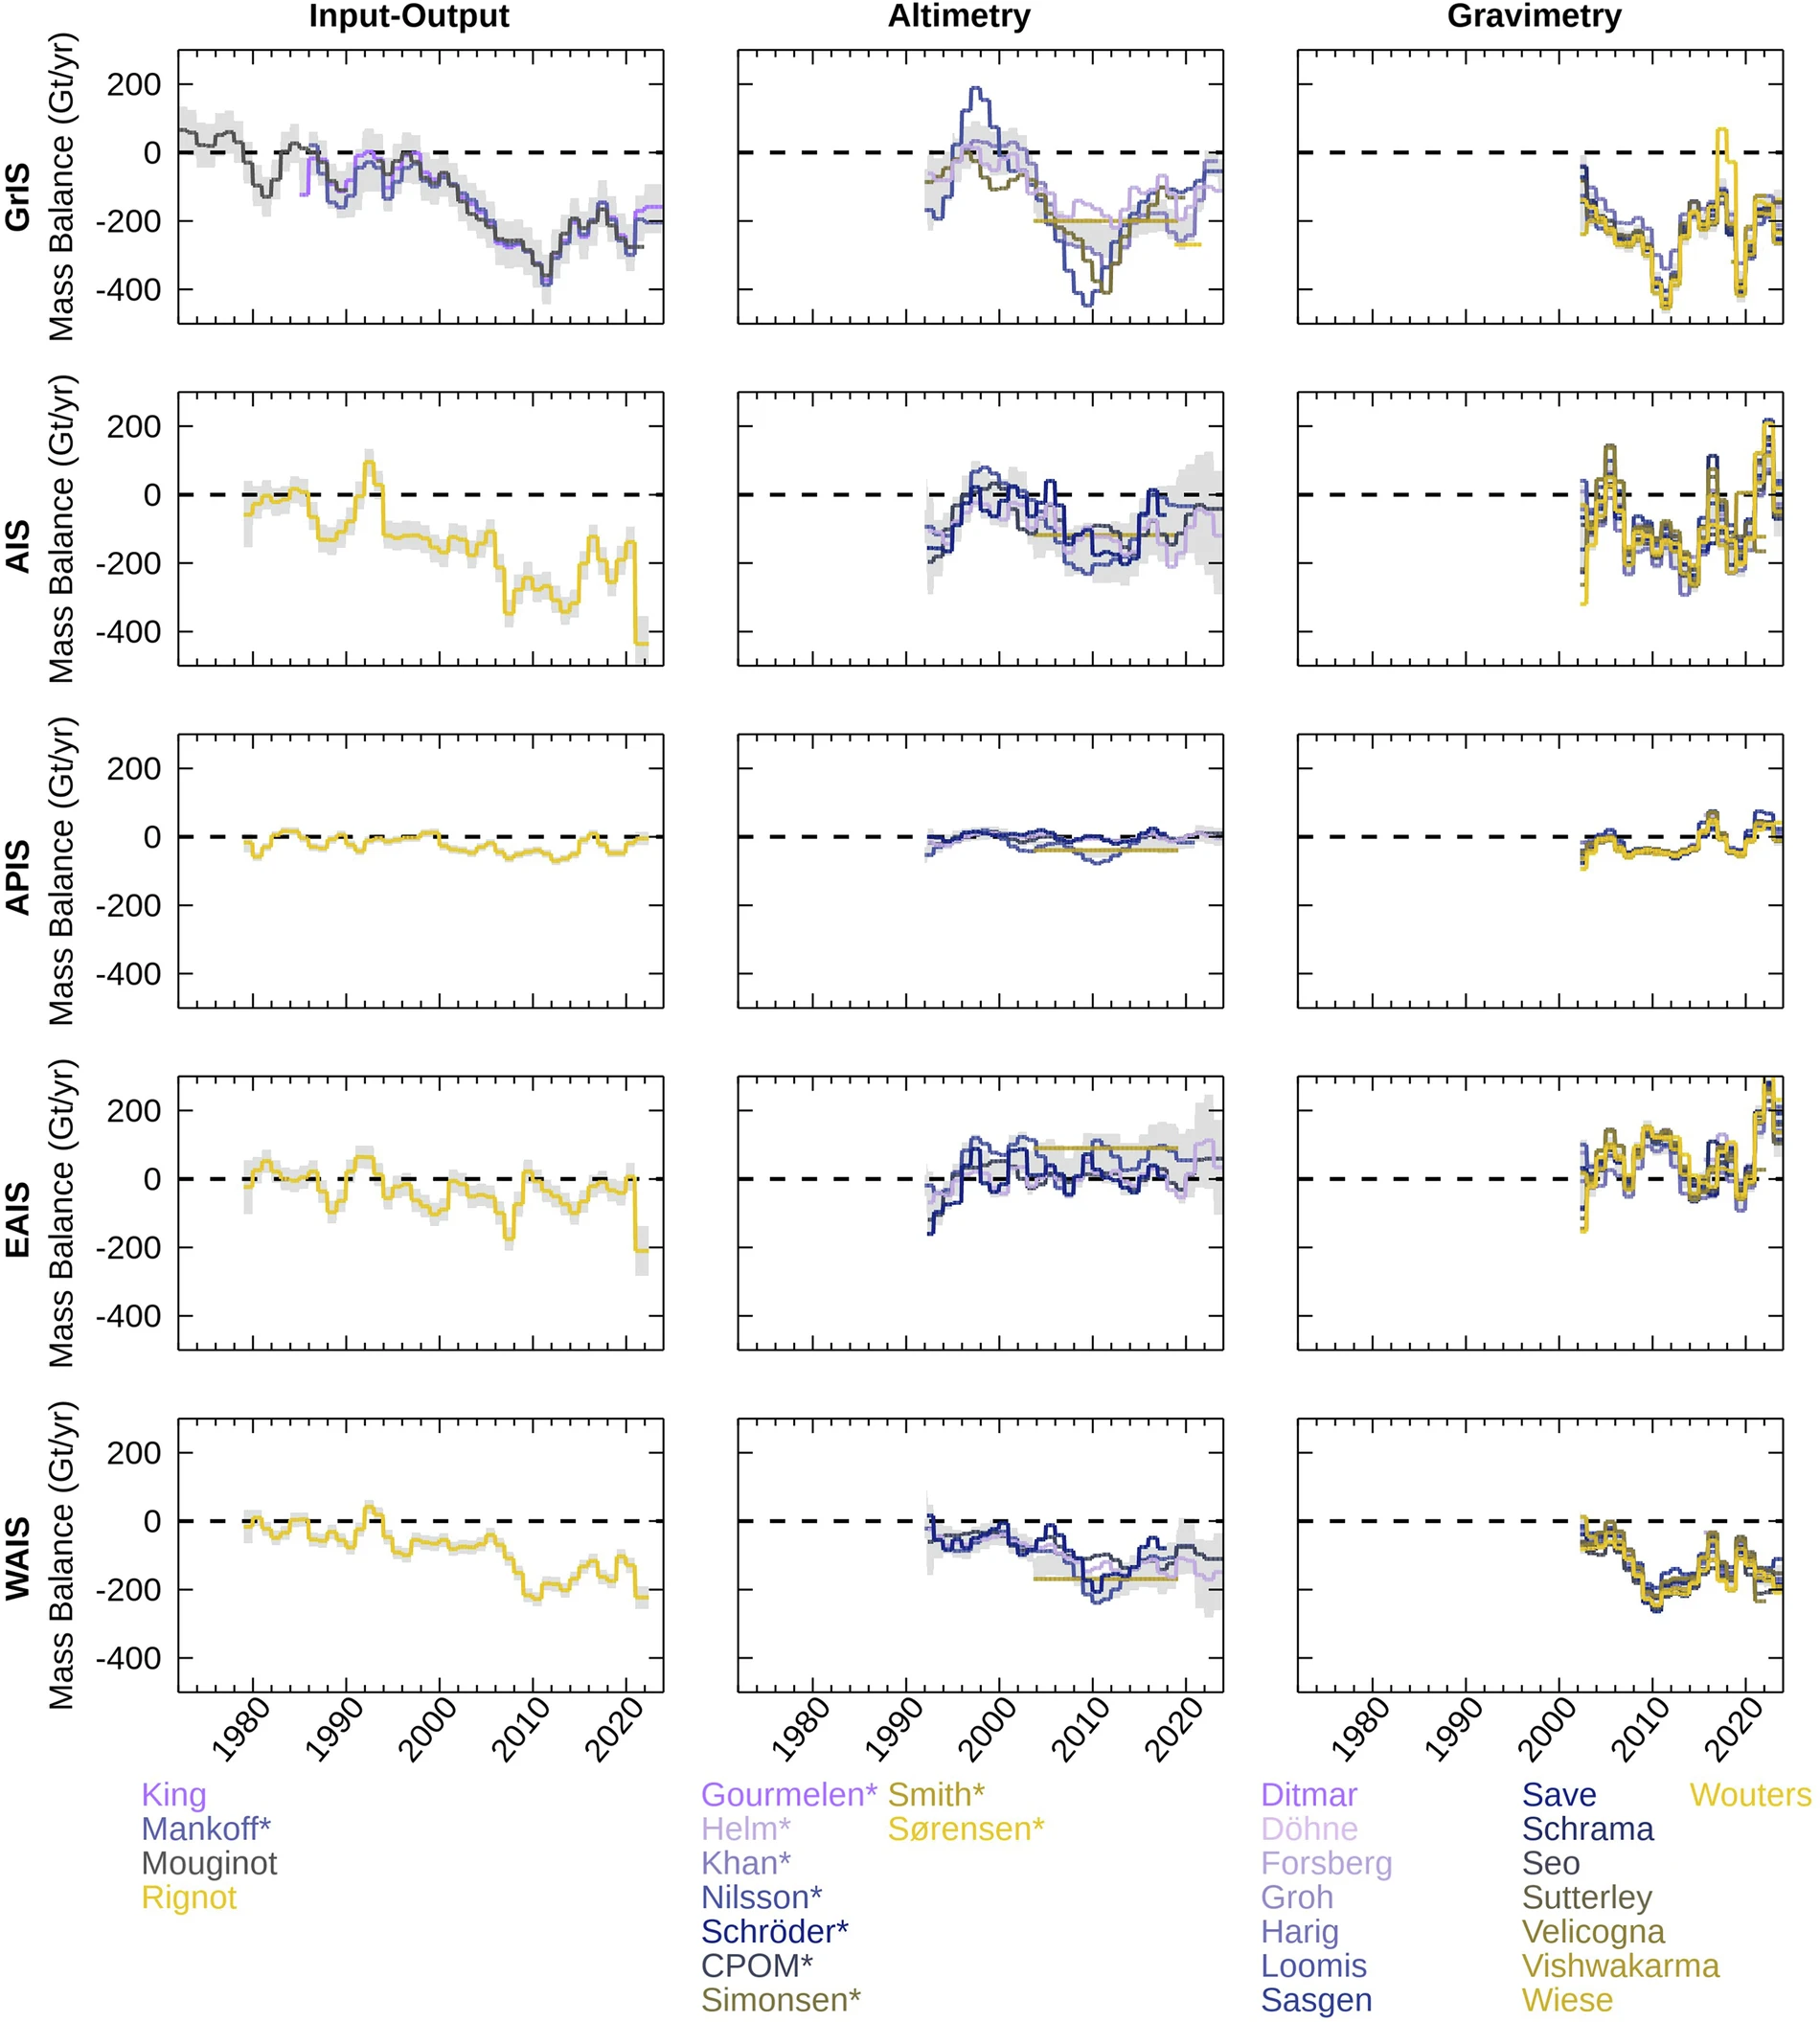
Glaciers and ice streams carried most of the ice lost from Greenland and Antarctica between 1979 and 2023, while the two ice sheets together shed an estimated 11.3 trillion tonnes of ice. The loss was not constant over that period. In West Antarctica, for example, the average rate of mass loss climbed from 29 billion tonnes a year in the 1980s to 163 billion tonnes a year in the 2010s, according to a new reconstruction that brings together decades of satellite measurements.
Tracking the mass of an ice sheet is not as simple as repeatedly weighing it. Greenland and Antarctica are too large for direct measurement, and different satellite techniques observe different parts of the problem.
Some measurements track changes in ice height. Others detect changes in Earth’s gravity caused by shifting amounts of ice. A third approach estimates how much ice is flowing through the edges of an ice sheet and compares that with how much snow is accumulating on its surface.
The new reconstruction combines these approaches to build a standardized record of ice-sheet mass balance. The dataset contains 42 independent estimates based on satellite observations of ice flow, ice volume and gravity, together with glacial-isostatic adjustment information and surface mass-balance models. In total, the work draws on observations from 27 satellite missions.
The record extends from 1972 to 2023 for Greenland and from 1979 to 2023 for Antarctica.
The researchers grouped the observations into three broad measurement approaches. The input-output method, or IOM, estimates the difference between snowfall and the amount of ice leaving the ice sheet through its margins. Altimetry measures changes in ice-sheet elevation. Gravimetry measures changes in mass through variations in Earth’s gravitational field.
Because the individual estimates do not all cover the same periods or have the same uncertainties, the researchers standardized them to monthly mass-change rates and combined them using an error-weighted approach. Estimates were first reconciled within each measurement group and then across the three groups.
That process produced a single time series for each ice sheet while retaining information about how much the different measurements disagreed.
The loss accelerated in parts of Antarctica
The combined record shows that Greenland and Antarctica lost 11,309 ± 565 billion tonnes of ice between 1979 and 2023.
Most of that change was associated with ice dynamics rather than changes in surface mass balance. The researchers estimate that 84% of the combined mass loss was driven by glacier dynamical imbalance. The remainder came from surface mass balance, which reflects the difference between snowfall and surface processes such as melting and runoff.
The balance between those processes varied substantially by region and over time.
West Antarctica showed one of the clearest changes. Its average mass loss increased from 29 ± 7 billion tonnes per year during the 1980s to 163 ± 12 billion tonnes per year during the 2010s.
The researchers also found that West Antarctica’s ice discharge increased by 38% during the final four years of the record. Increased surface mass balance partly offset that rise, so the change in total mass was not simply a reflection of ice discharge alone.
The study separates the ice sheets into regions because their mass changes are not uniform. Antarctica’s East, West and Antarctic Peninsula regions can behave differently, and combining them into a single Antarctic number can hide important differences in the underlying measurements.
Greenland’s estimates converge in the satellite era
For Greenland, the different satellite techniques show relatively close agreement over the period when all three approaches overlap most strongly.
Between 2002 and 2023, the three methods had a standard deviation of 24 billion tonnes per year around their estimates. The reconciled result for that period was a mass loss of 236 ± 12 billion tonnes per year.
The longer Greenland record also required an adjustment for peripheral glaciers and ice caps around the main ice sheet. These smaller bodies of ice contributed an estimated 8.0 ± 0.5 billion tonnes of mass loss per year from 1972 through 2023.
That contribution changed over time. The estimated loss from Greenland’s peripheral glaciers and ice caps rose from 4.4 ± 0.8 billion tonnes per year in the 1990s to 18.9 ± 1.3 billion tonnes per year in the 2010s.
The researchers treated these peripheral glaciers separately because the study is focused on the mass balance of the Greenland and Antarctic ice sheets. For Greenland, they corrected the relevant altimetry estimates for the contribution from these surrounding glaciers and ice caps.
Antarctica presented a different problem. Estimates of mass change from its peripheral glaciers and ice caps disagreed substantially, so the Antarctic altimetry series was not corrected for them.
Antarctica is harder to reconcile
The disagreement among measurement methods becomes much larger in Antarctica, particularly in East Antarctica.
For the Antarctic ice sheet as a whole, the reconciled mass-loss estimate for 2002–2021 was 169 ± 17 billion tonnes per year. But the spread among the three measurement groups was 70 billion tonnes per year.
The disagreement was not equally large everywhere. The standard deviations among methods were only 4 billion tonnes per year for West Antarctica and 7 billion tonnes per year for the Antarctic Peninsula. In East Antarctica, however, the standard deviation reached 61 billion tonnes per year.
In some cases, the methods do not even agree on whether a region gained or lost mass.
The largest difference occurred in East Antarctica. For 2021, the input-output estimate indicated a loss of 210 ± 73 billion tonnes, while the altimetry estimate indicated a gain of 99 ± 124 billion tonnes and the gravimetry estimate indicated a gain of 166 ± 50 billion tonnes.
The researchers note that only one input-output estimate was available for East Antarctica. Because the reconciliation method weights estimates according to their uncertainties, that single estimate receives substantial influence in the combined result. The authors say this may introduce a small underestimation of mass gains in East Antarctica.
They point to a specific observational gap that makes the discrepancy difficult to resolve. More than 60% of the grounding line in the specified East Antarctic regions lacks a bed-topography measurement within 5 kilometers. Grounding-line ice thickness is important for the input-output method because it helps determine how much ice is flowing out of the grounded ice sheet.
The disagreement therefore remains an unresolved part of the reconstruction rather than something the researchers eliminate by choosing one measurement technique over another.
Three ways of measuring a changing ice sheet
Each of the three main approaches sees a different physical signal.
The input-output method combines measurements of ice flowing across the grounding line with estimates of surface mass balance. If more ice leaves the grounded ice sheet than is being added at its surface, the difference represents mass loss.
Altimetry instead measures changes in the height of the ice surface. Repeated observations can reveal whether the ice sheet is becoming thicker or thinner, although translating elevation change into mass change requires information about the density and properties of the changing material.
Gravimetry detects changes in Earth’s gravitational field associated with changes in mass. It provides a direct way of observing large-scale mass changes, but the measurements require corrections and modeling, including for changes in Earth’s crust associated with the redistribution of ice.
The study does not simply average the three techniques without accounting for their uncertainties. The researchers first standardized the individual records, combined estimates within each technique group and then reconciled the groups using inverse-square error weighting.
Uncertainties from independent components were combined in quadrature. For the longer cumulative totals, the uncertainties were propagated using a root-sum-square approach.
The result is intended to provide a consistent mass-balance dataset rather than to establish that any one observational technique is always correct.
The newer record differs from an earlier assessment
The researchers also compared their reconstruction with the previous IMBIE assessment covering 1992 through 2020.
For Greenland, the new estimate of the average mass-loss rate was 180 ± 12 billion tonnes per year, compared with 169 ± 16 billion tonnes per year in the previous assessment. The researchers report that the two estimates agree within their uncertainties.
The year-by-year Greenland series also agrees within uncertainties throughout the comparison period.
Antarctica shows a larger difference. The new assessment gives an average mass-loss rate of 140 ± 13 billion tonnes per year for 1992–2020, compared with 92 ± 18 billion tonnes per year in the earlier assessment.
The differences were not uniform across Antarctica. The researchers report statistically significant differences for the Antarctic Peninsula and West Antarctica, with p-values of 0.01 and 0.03, respectively. Four years in the Antarctic Peninsula series, three years in the West Antarctic series and two years in the full Antarctic series fell outside the uncertainty bounds of the previous assessment.
A major part of the Antarctic Peninsula difference comes from updated altimetry observations. The new assessment gives an Antarctic Peninsula altimetry mass-loss rate of 20 ± 3 billion tonnes per year, compared with 6 ± 1 billion tonnes per year in the previous assessment. The difference between those altimetry series is statistically significant, with a reported p-value of 0.001.
These comparisons illustrate why long-term ice-sheet records are periodically revised. As new satellite observations become available and earlier measurements are reprocessed or extended, estimates of past mass balance can change.
Surface mass balance tells only part of the story
The researchers also separated total mass changes into surface mass balance and ice dynamics.
Surface mass balance describes processes occurring at the ice surface. Snowfall adds mass, while processes including surface melting and runoff remove it. Ice dynamics describe changes associated with the movement and discharge of ice through the ice sheet.
To estimate the surface component, the researchers combined regional climate-model estimates. Four models or model-based datasets were used for Antarctica and three for Greenland, with uncertainties based on comparisons between model results and observations.
The resulting partition shows that changes in ice dynamics account for most of the combined Greenland and Antarctic mass loss over the period examined.
That does not mean surface processes were unimportant or moved in only one direction. The balance between the two components varied by region and time. In West Antarctica, for example, an increase in surface mass balance during the final four years partly offset the increase in ice discharge.
The distinction is important to the reconstruction because an ice sheet can lose mass either because less snow accumulates or because ice is transported out more rapidly. The study treats those processes separately rather than reducing all mass change to a single measurement.
What the record does not measure
The dataset is designed specifically to quantify changes in grounded ice-sheet mass that contribute to sea-level change. It does not attempt to quantify ice loss associated with thinning or retreat of floating ice shelves, or retreat of grounded ice below sea level.
That scope also helps explain why the researchers treat some observations differently. Peripheral glaciers and ice caps are outside the main ice-sheet mass balance, while floating ice shelves are not included in the grounded-ice mass-change accounting.
The authors also emphasize the uneven quality of the observational record. Greenland’s three methods converge relatively closely during the period when they overlap, while Antarctica, particularly East Antarctica, retains substantial disagreement between techniques.
The resulting dataset therefore preserves both the combined estimate and the uncertainty surrounding it. Rather than treating the individual satellite records as interchangeable, the reconstruction uses their differences to characterize uncertainty and identify where additional observations are needed.
For the period from 1979 through 2023, the combined estimate remains 11,309 ± 565 billion tonnes of ice lost from Greenland and Antarctica, with glacier dynamics accounting for an estimated 84% of that loss. The strongest regional changes occur in places such as West Antarctica, while the measurements remain substantially less consistent in parts of East Antarctica.
The study was published in Scientific Data.